Estimated Value: $268,911 - $388,000
2
Beds
1
Bath
900
Sq Ft
$365/Sq Ft
Est. Value
About This Home
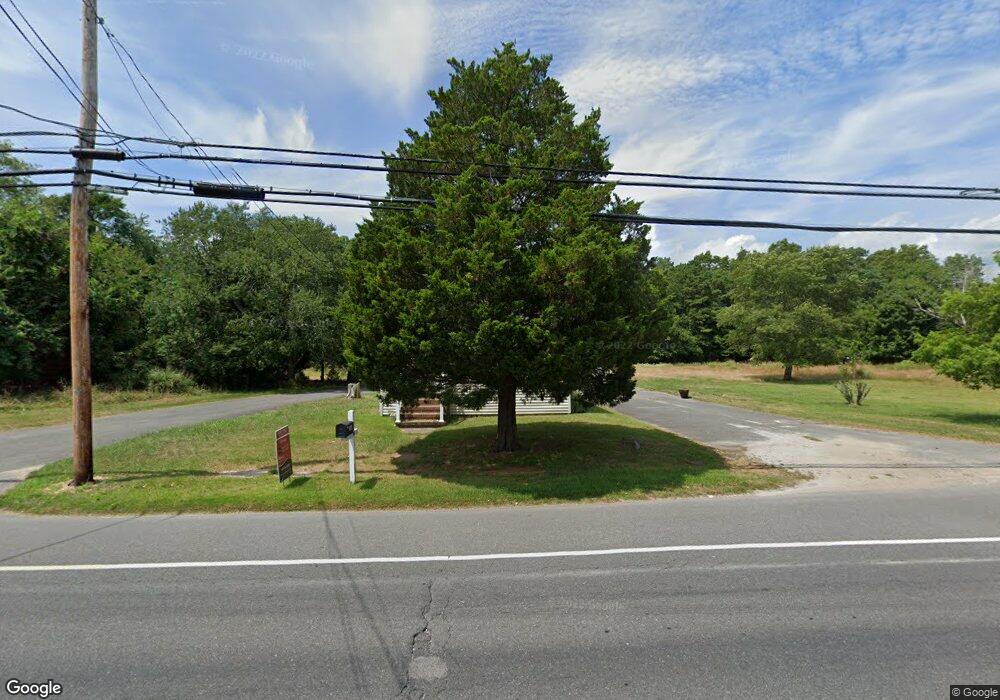
This home is located at 765 Route 9 N, Little Egg Harbor Township, NJ 08087 and is currently estimated at $328,228, approximately $364 per square foot. 765 Route 9 N is a home located in Ocean County with nearby schools including Frog Pond Elementary School, Pinelands Regional Junior High School, and Pinelands Regional High School.
Ownership History
Date
Name
Owned For
Owner Type
Purchase Details
Closed on
Apr 13, 2012
Sold by
Price Jonathan W
Bought by
Price John and Price Sheryl
Current Estimated Value
Home Financials for this Owner
Home Financials are based on the most recent Mortgage that was taken out on this home.
Original Mortgage
$90,000
Interest Rate
3.14%
Mortgage Type
Purchase Money Mortgage
Purchase Details
Closed on
Jul 27, 2010
Sold by
Price Jonathan W and Price Jeremy S
Bought by
Price Jonathan W
Purchase Details
Closed on
Jul 27, 2007
Sold by
Price Jonathan W
Bought by
Price Jonathan W and Price Jeremy S
Home Financials for this Owner
Home Financials are based on the most recent Mortgage that was taken out on this home.
Original Mortgage
$183,750
Interest Rate
6.72%
Mortgage Type
New Conventional
Purchase Details
Closed on
Jan 19, 1999
Sold by
Price Mason Conrad
Bought by
Price Mason Conrad
Create a Home Valuation Report for This Property
The Home Valuation Report is an in-depth analysis detailing your home's value as well as a comparison with similar homes in the area
Home Values in the Area
Average Home Value in this Area
Purchase History
| Date | Buyer | Sale Price | Title Company |
|---|---|---|---|
| Price John | $140,000 | Fidelity National Title | |
| Price Jonathan W | -- | None Available | |
| Price Jonathan W | -- | First Option Title Agency Ll | |
| Price Mason Conrad | -- | -- |
Source: Public Records
Mortgage History
| Date | Status | Borrower | Loan Amount |
|---|---|---|---|
| Closed | Price John | $90,000 | |
| Closed | Price Jonathan W | $183,750 |
Source: Public Records
Tax History Compared to Growth
Tax History
| Year | Tax Paid | Tax Assessment Tax Assessment Total Assessment is a certain percentage of the fair market value that is determined by local assessors to be the total taxable value of land and additions on the property. | Land | Improvement |
|---|---|---|---|---|
| 2025 | $4,986 | $172,500 | $93,600 | $78,900 |
| 2024 | $4,779 | $165,600 | $93,600 | $72,000 |
| 2023 | $4,625 | $165,600 | $93,600 | $72,000 |
| 2022 | $4,625 | $165,600 | $93,600 | $72,000 |
| 2021 | $4,511 | $165,600 | $93,600 | $72,000 |
| 2020 | $4,451 | $165,600 | $93,600 | $72,000 |
| 2019 | $4,271 | $165,600 | $93,600 | $72,000 |
| 2018 | $4,032 | $165,600 | $93,600 | $72,000 |
| 2017 | $3,973 | $165,600 | $93,600 | $72,000 |
| 2016 | $4,001 | $165,600 | $93,600 | $72,000 |
| 2015 | $4,021 | $165,600 | $93,600 | $72,000 |
| 2014 | $4,754 | $246,700 | $180,100 | $66,600 |
Source: Public Records
Map
Nearby Homes