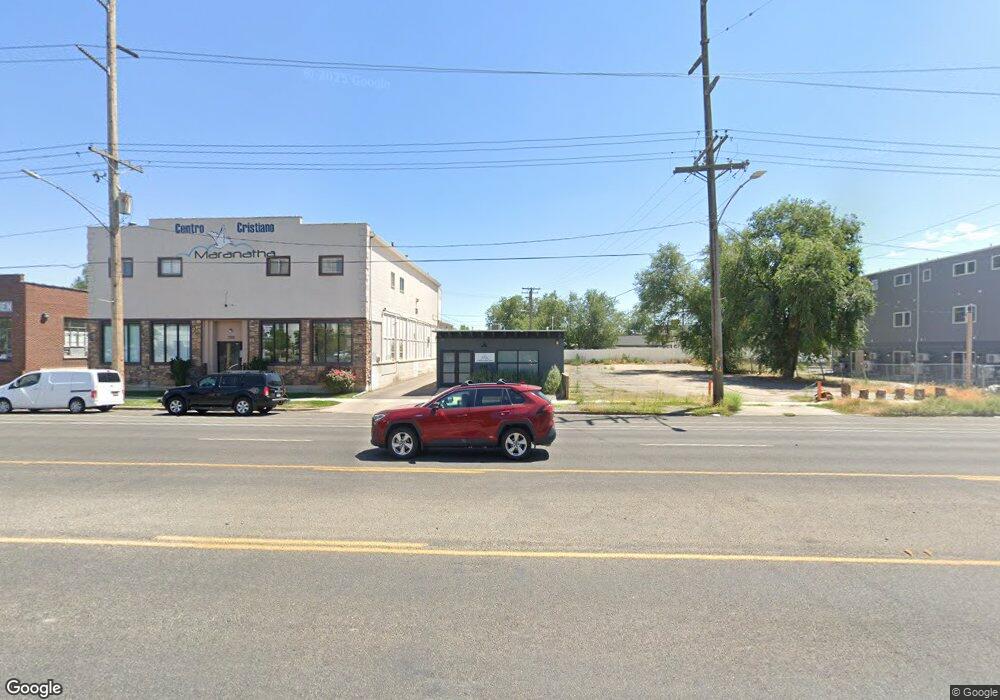
765 W 800 S Salt Lake City, UT 84104
Poplar Grove Neighborhood
--
Bed
--
Bath
1,300
Sq Ft
5,227
Sq Ft Lot
About This Home
This home is located at 765 W 800 S, Salt Lake City, UT 84104. 765 W 800 S is a home located in Salt Lake County with nearby schools including Riley Elementary School, Glendale Middle, and Highland High School.
Ownership History
Date
Name
Owned For
Owner Type
Purchase Details
Closed on
Jul 27, 2020
Sold by
Daley Holding Company Llc
Bought by
True Real Estate Holdings Llc and Series 376 East 300 South Llc
Home Financials for this Owner
Home Financials are based on the most recent Mortgage that was taken out on this home.
Original Mortgage
$1,020,000
Outstanding Balance
$908,136
Interest Rate
3.2%
Mortgage Type
Construction
Purchase Details
Closed on
Feb 16, 2016
Sold by
Brewer Barbara
Bought by
Rockwood Investment Group Llc
Home Financials for this Owner
Home Financials are based on the most recent Mortgage that was taken out on this home.
Original Mortgage
$160,000
Interest Rate
3.81%
Mortgage Type
Commercial
Purchase Details
Closed on
May 12, 1992
Sold by
Hollenbeck Thomas Neal and Hollenbeck Colleen K
Bought by
Sheldon Robert B
Create a Home Valuation Report for This Property
The Home Valuation Report is an in-depth analysis detailing your home's value as well as a comparison with similar homes in the area
Home Values in the Area
Average Home Value in this Area
Purchase History
| Date | Buyer | Sale Price | Title Company |
|---|---|---|---|
| True Real Estate Holdings Llc | -- | Title Guarantee Fort Union | |
| Rockwood Investment Group Llc | -- | Old Republic Title So Jordan | |
| Sheldon Robert B | -- | None Available |
Source: Public Records
Mortgage History
| Date | Status | Borrower | Loan Amount |
|---|---|---|---|
| Open | True Real Estate Holdings Llc | $1,020,000 | |
| Previous Owner | Rockwood Investment Group Llc | $160,000 |
Source: Public Records
Tax History Compared to Growth
Tax History
| Year | Tax Paid | Tax Assessment Tax Assessment Total Assessment is a certain percentage of the fair market value that is determined by local assessors to be the total taxable value of land and additions on the property. | Land | Improvement |
|---|---|---|---|---|
| 2025 | $2,122 | $233,600 | $119,800 | $113,800 |
| 2024 | $2,122 | $222,700 | $87,100 | $135,600 |
| 2023 | $1,354 | $137,000 | $59,900 | $77,100 |
| 2022 | $1,449 | $137,500 | $46,100 | $91,400 |
| 2021 | $1,390 | $119,400 | $64,600 | $54,800 |
| 2020 | $1,442 | $117,900 | $64,600 | $53,300 |
| 2019 | $1,523 | $117,200 | $63,000 | $54,200 |
| 2018 | $1,424 | $106,700 | $53,600 | $53,100 |
| 2017 | $1,474 | $103,500 | $50,400 | $53,100 |
| 2016 | $1,725 | $60,300 | $49,200 | $11,100 |
| 2015 | $929 | $58,700 | $48,500 | $10,200 |
| 2014 | $916 | $57,400 | $47,300 | $10,100 |
Source: Public Records
Map
Nearby Homes