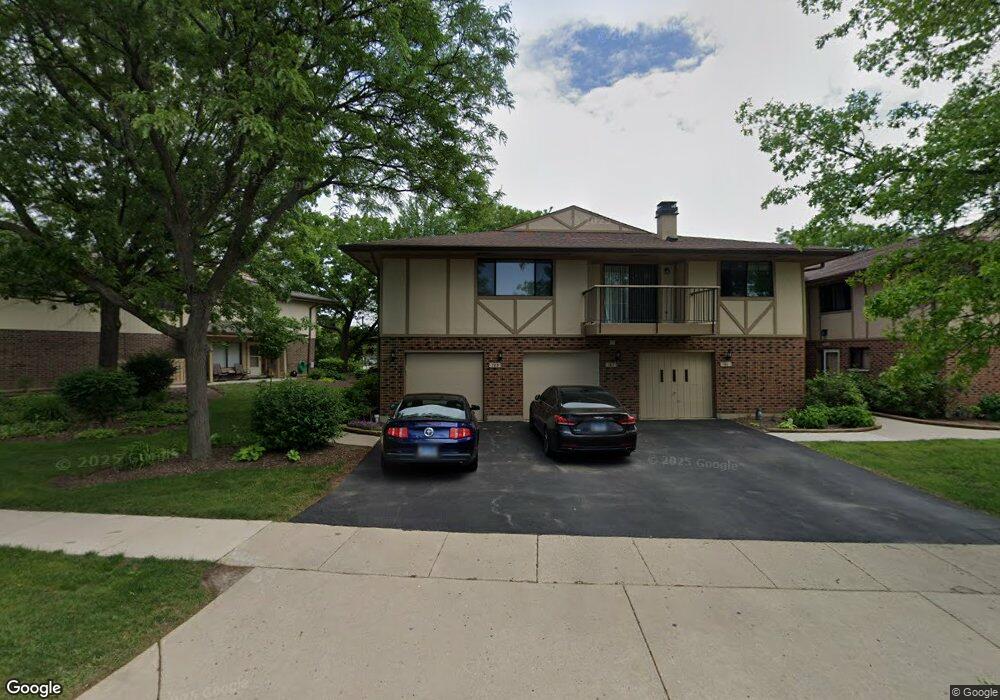
765 Whalom Ln Unit 2C1 Schaumburg, IL 60173
Woodfield NeighborhoodEstimated Value: $268,000 - $312,000
3
Beds
--
Bath
1,100
Sq Ft
$263/Sq Ft
Est. Value
About This Home
This home is located at 765 Whalom Ln Unit 2C1, Schaumburg, IL 60173 and is currently estimated at $289,840, approximately $263 per square foot. 765 Whalom Ln Unit 2C1 is a home located in Cook County with nearby schools including Fairview Elementary School, Helen Keller Junior High School, and J B Conant High School.
Ownership History
Date
Name
Owned For
Owner Type
Purchase Details
Closed on
Aug 29, 2016
Sold by
Pavlik Deborah A
Bought by
Ruda Denise M
Current Estimated Value
Home Financials for this Owner
Home Financials are based on the most recent Mortgage that was taken out on this home.
Original Mortgage
$165,750
Outstanding Balance
$132,692
Interest Rate
3.5%
Mortgage Type
New Conventional
Estimated Equity
$157,148
Purchase Details
Closed on
Sep 22, 2014
Sold by
Pavlik Deborah A
Bought by
Pavlik Deborah A and Deborah A Pavlik Trust
Purchase Details
Closed on
Apr 20, 2006
Sold by
Wilson Karen and Watt Kenneth G
Bought by
Pavlik Deborah A
Home Financials for this Owner
Home Financials are based on the most recent Mortgage that was taken out on this home.
Original Mortgage
$139,000
Interest Rate
6.5%
Mortgage Type
Adjustable Rate Mortgage/ARM
Purchase Details
Closed on
Dec 4, 1998
Sold by
Watt Kenneth G and Watt Eleanor G
Bought by
Watt Kenneth G and Watt Eleanor G
Create a Home Valuation Report for This Property
The Home Valuation Report is an in-depth analysis detailing your home's value as well as a comparison with similar homes in the area
Home Values in the Area
Average Home Value in this Area
Purchase History
| Date | Buyer | Sale Price | Title Company |
|---|---|---|---|
| Ruda Denise M | $195,000 | First American Title | |
| Pavlik Deborah A | -- | None Available | |
| Pavlik Deborah A | $219,000 | Oconnor Title Services Inc | |
| Watt Kenneth G | -- | -- |
Source: Public Records
Mortgage History
| Date | Status | Borrower | Loan Amount |
|---|---|---|---|
| Open | Ruda Denise M | $165,750 | |
| Previous Owner | Pavlik Deborah A | $139,000 |
Source: Public Records
Tax History Compared to Growth
Tax History
| Year | Tax Paid | Tax Assessment Tax Assessment Total Assessment is a certain percentage of the fair market value that is determined by local assessors to be the total taxable value of land and additions on the property. | Land | Improvement |
|---|---|---|---|---|
| 2024 | $4,626 | $19,832 | $2,655 | $17,177 |
| 2023 | $4,458 | $19,832 | $2,655 | $17,177 |
| 2022 | $4,458 | $19,832 | $2,655 | $17,177 |
| 2021 | $3,543 | $15,021 | $1,880 | $13,141 |
| 2020 | $3,550 | $15,021 | $1,880 | $13,141 |
| 2019 | $3,602 | $16,866 | $1,880 | $14,986 |
| 2018 | $2,811 | $12,800 | $1,548 | $11,252 |
| 2017 | $3,781 | $12,800 | $1,548 | $11,252 |
| 2016 | $2,846 | $12,800 | $1,548 | $11,252 |
| 2015 | $2,667 | $11,537 | $1,437 | $10,100 |
| 2014 | $2,654 | $11,537 | $1,437 | $10,100 |
| 2013 | $2,568 | $11,537 | $1,437 | $10,100 |
Source: Public Records
Map
Nearby Homes
- 845 Dracut Ln
- 802 Stonewall Ct Unit 55
- 465 Apache Ln
- 705 Ash Rd
- 751 Edgelake Point Unit 68C
- 325 Bayview Point Unit 56B
- 613 Bayview Point Unit 49A
- 1250 Woodfield Rd
- 1180 Apple St
- 1190 Apple St
- 601 Hanover Ct Unit Z2
- 700 Cumberland St
- 602 Eastview Ct Unit Z1
- 600 Eastview Ct Unit X1
- 121 Chatsworth Cir
- 100 Des Plaines Ln
- 1535 Columbine Dr Unit 1
- 22 Ascot Cir
- 1527 Lexington Cir
- 28 Ascot Cir
- 765 Whalom Ln Unit 2C
- 761 Whalom Ln Unit 2B1
- 759 Whalom Ln Unit 2B2
- 757 Whalom Ln Unit 1A
- 755 Whalom Ln Unit 2C2
- 777 Whalom Ln Unit 1B2
- 773 Whalom Ln Unit 1C2
- 747 Whalom Ln Unit 3C1
- 779 Whalom Ln Unit 1B1
- 745 Whalom Ln Unit 3A1
- 781 Whalom Ln Unit 1A1
- 743 Whalom Ln Unit 3B1
- 783 Whalom Ln Unit 1C1
- 762 Whalom Ln Unit 5C1
- 737 Whalom Ln Unit 3C2
- 768 Whalom Ln Unit 5B2
- 768 Whalom Ln Unit D
- 741 Whalom Ln Unit 3B2
- 770 Whalom Ln Unit 5A2
- 772 Whalom Ln Unit 5C2