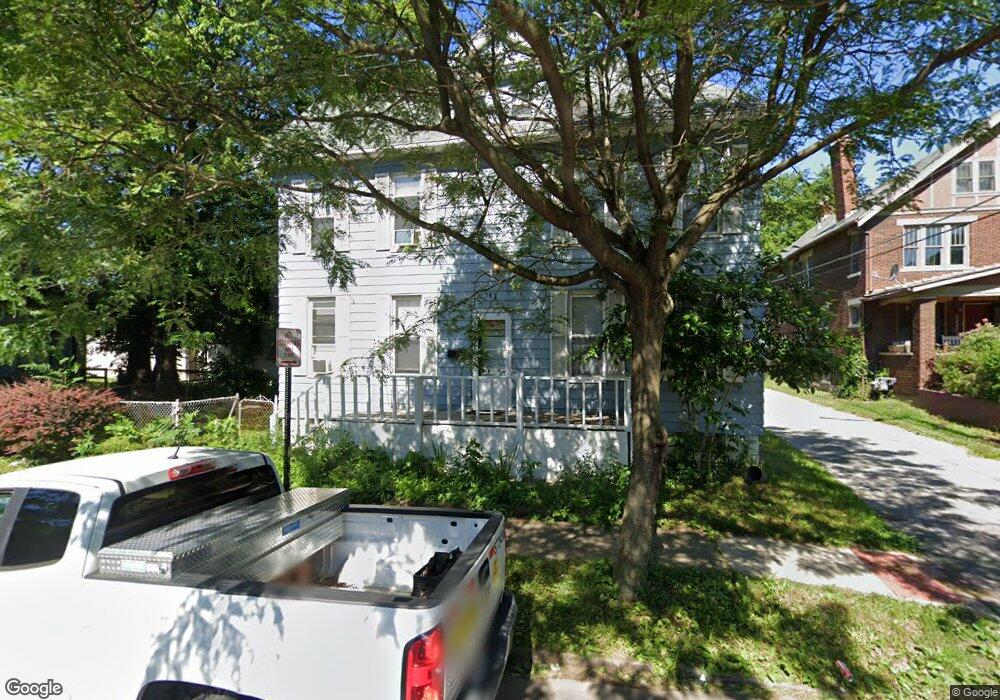
765 Wilson Ave Columbus, OH 43205
Livingston Park NeighborhoodEstimated Value: $166,912 - $343,000
3
Beds
1
Bath
1,408
Sq Ft
$178/Sq Ft
Est. Value
About This Home
This home is located at 765 Wilson Ave, Columbus, OH 43205 and is currently estimated at $249,978, approximately $177 per square foot. 765 Wilson Ave is a home located in Franklin County with nearby schools including Livingston Elementary School, South High School, and Capital Collegiate Preparatory Academy.
Ownership History
Date
Name
Owned For
Owner Type
Purchase Details
Closed on
Jul 12, 2021
Sold by
Hardwick William G
Bought by
Hardwick William G and Hardwick Steven C
Current Estimated Value
Purchase Details
Closed on
Jan 17, 2007
Sold by
Hardwick Steven C and Hardwick Young Ra
Bought by
Hardwick William G
Home Financials for this Owner
Home Financials are based on the most recent Mortgage that was taken out on this home.
Original Mortgage
$72,000
Outstanding Balance
$42,979
Interest Rate
6.19%
Mortgage Type
Purchase Money Mortgage
Estimated Equity
$206,999
Purchase Details
Closed on
Nov 20, 1996
Sold by
Capital City Real Estate
Bought by
Steven C Hardwick
Home Financials for this Owner
Home Financials are based on the most recent Mortgage that was taken out on this home.
Original Mortgage
$55,600
Interest Rate
7.94%
Mortgage Type
New Conventional
Purchase Details
Closed on
Jul 8, 1996
Sold by
Bice Margaret F
Bought by
Capital City Real Estate Services Inc
Purchase Details
Closed on
Dec 13, 1991
Create a Home Valuation Report for This Property
The Home Valuation Report is an in-depth analysis detailing your home's value as well as a comparison with similar homes in the area
Home Values in the Area
Average Home Value in this Area
Purchase History
| Date | Buyer | Sale Price | Title Company |
|---|---|---|---|
| Hardwick William G | -- | None Available | |
| Hardwick William G | $90,000 | Title First | |
| Steven C Hardwick | $69,500 | -- | |
| Capital City Real Estate Services Inc | $11,000 | -- | |
| -- | -- | -- |
Source: Public Records
Mortgage History
| Date | Status | Borrower | Loan Amount |
|---|---|---|---|
| Open | Hardwick William G | $72,000 | |
| Previous Owner | Steven C Hardwick | $55,600 |
Source: Public Records
Tax History Compared to Growth
Tax History
| Year | Tax Paid | Tax Assessment Tax Assessment Total Assessment is a certain percentage of the fair market value that is determined by local assessors to be the total taxable value of land and additions on the property. | Land | Improvement |
|---|---|---|---|---|
| 2024 | $1,789 | $35,710 | $15,090 | $20,620 |
| 2023 | $1,616 | $35,700 | $15,085 | $20,615 |
| 2022 | $1,161 | $21,850 | $7,110 | $14,740 |
| 2021 | $1,163 | $21,850 | $7,110 | $14,740 |
| 2020 | $1,165 | $21,850 | $7,110 | $14,740 |
| 2019 | $1,045 | $16,800 | $5,460 | $11,340 |
| 2018 | $779 | $16,800 | $5,460 | $11,340 |
| 2017 | $892 | $19,600 | $5,460 | $14,140 |
| 2016 | $566 | $8,330 | $2,800 | $5,530 |
| 2015 | $515 | $8,330 | $2,800 | $5,530 |
| 2014 | $517 | $8,330 | $2,800 | $5,530 |
| 2013 | $268 | $8,750 | $2,940 | $5,810 |
Source: Public Records
Map
Nearby Homes
- 1186-1188 E Livingston Ave Unit 1186
- 1157 E Livingston Ave
- 1121 E Livingston Ave
- 834 Wilson Ave
- 831 Wilson Ave
- 734 Linwood Ave
- 1225 E Livingston Ave
- 1096 E Sycamore St
- 829-831 Studer Ave
- 851 Studer Ave
- 855 Studer Ave
- 730 S Champion Ave
- 668 Wilson Ave
- 791-793 S Champion Ave
- 911 Linwood Ave Unit & 913
- 1036 Newton St Unit 38
- 712 S Ohio Ave
- 900-902 Oakwood Ave
- 688 S Ohio Ave
- 786 S Ohio Ave
- 1136-1138 E Livingston Ave
- 1136-1138 E Livingston Ave Unit 2
- 1136 E Livingston Ave Unit 138
- 757 Wilson Ave Unit 759
- 768 Wilson Ave Unit 770
- 755 Wilson Ave
- 762 Wilson Ave
- 745 Wilson Ave
- 1160 E Livingston Ave
- 756 Wilson Ave
- 741 Wilson Ave
- 1166 E Livingston Ave
- 754 Wilson Ave
- 739 Wilson Ave
- 1135 E Livingston Ave
- 737 Wilson Ave Unit 739
- 737-739 Wilson Ave
- 750 Wilson Ave
- 1170 E Livingston Ave
- 1108 E Livingston Ave