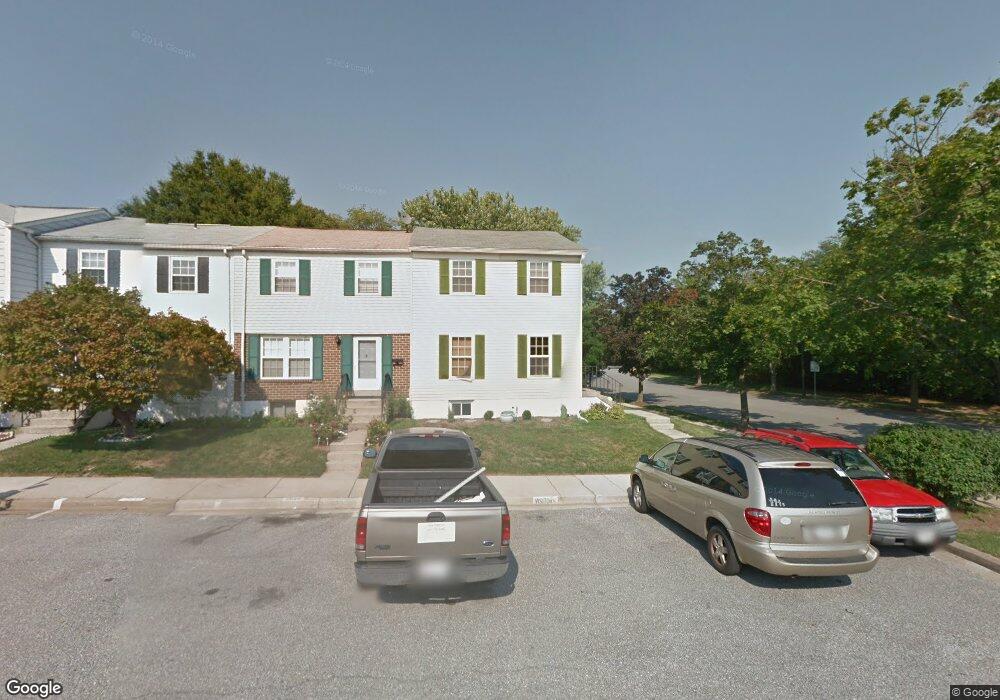
7650 Odaniel Ct Glen Burnie, MD 21061
Estimated Value: $257,000 - $360,000
Studio
2
Baths
1,160
Sq Ft
$268/Sq Ft
Est. Value
About This Home
This home is located at 7650 Odaniel Ct, Glen Burnie, MD 21061 and is currently estimated at $310,984, approximately $268 per square foot. 7650 Odaniel Ct is a home located in Anne Arundel County with nearby schools including Richard Henry Lee Elementary School, Corkran Middle School, and Glen Burnie High School.
Ownership History
Date
Name
Owned For
Owner Type
Purchase Details
Closed on
Aug 7, 2007
Sold by
Boston Sharon B
Bought by
Gross Sharon B and Gross Kelly
Current Estimated Value
Home Financials for this Owner
Home Financials are based on the most recent Mortgage that was taken out on this home.
Original Mortgage
$222,589
Outstanding Balance
$141,436
Interest Rate
6.73%
Mortgage Type
Stand Alone Refi Refinance Of Original Loan
Estimated Equity
$169,548
Purchase Details
Closed on
Jul 20, 2007
Sold by
Boston Sharon B
Bought by
Gross Sharon B and Gross Kelly
Home Financials for this Owner
Home Financials are based on the most recent Mortgage that was taken out on this home.
Original Mortgage
$222,589
Outstanding Balance
$141,436
Interest Rate
6.73%
Mortgage Type
Stand Alone Refi Refinance Of Original Loan
Estimated Equity
$169,548
Purchase Details
Closed on
Jan 19, 1999
Sold by
Bruchalski Stephen
Bought by
Boston Sharon B
Purchase Details
Closed on
Dec 13, 1993
Sold by
Pugh M C
Bought by
Bruchalski Stephen
Home Financials for this Owner
Home Financials are based on the most recent Mortgage that was taken out on this home.
Original Mortgage
$94,850
Interest Rate
6.78%
Create a Home Valuation Report for This Property
The Home Valuation Report is an in-depth analysis detailing your home's value as well as a comparison with similar homes in the area
Home Values in the Area
Average Home Value in this Area
Purchase History
| Date | Buyer | Sale Price | Title Company |
|---|---|---|---|
| Gross Sharon B | -- | -- | |
| Gross Sharon B | -- | -- | |
| Boston Sharon B | $91,500 | -- | |
| Bruchalski Stephen | $93,000 | -- |
Source: Public Records
Mortgage History
| Date | Status | Borrower | Loan Amount |
|---|---|---|---|
| Open | Gross Sharon B | $222,589 | |
| Closed | Gross Sharon B | $222,589 | |
| Previous Owner | Bruchalski Stephen | $94,850 | |
| Closed | Boston Sharon B | -- |
Source: Public Records
Tax History
| Year | Tax Paid | Tax Assessment Tax Assessment Total Assessment is a certain percentage of the fair market value that is determined by local assessors to be the total taxable value of land and additions on the property. | Land | Improvement |
|---|---|---|---|---|
| 2025 | $2,088 | $259,600 | $115,000 | $144,600 |
| 2024 | $2,088 | $244,267 | -- | -- |
| 2023 | $2,014 | $228,933 | $0 | $0 |
| 2022 | $2,232 | $213,600 | $105,000 | $108,600 |
| 2020 | $1,744 | $185,000 | $0 | $0 |
| 2019 | $3,351 | $170,700 | $60,000 | $110,700 |
| 2018 | $1,731 | $170,700 | $60,000 | $110,700 |
| 2017 | $1,648 | $170,700 | $0 | $0 |
| 2016 | -- | $192,800 | $0 | $0 |
| 2015 | -- | $188,967 | $0 | $0 |
| 2014 | -- | $185,133 | $0 | $0 |
Source: Public Records
Map
Nearby Homes
- 7611 Mcnamara Dr
- 718 Mayo Rd
- 418 Rose Ave
- 326 Thelma Ave
- 5717 Howard Dr
- 265 Truck Farm Dr
- 1106 Curtis Way
- 558 Elizabeth Ln
- 450 West Ct Unit 14I
- 392 West Ct Unit 2B
- 538 Elizabeth Ln
- 596 West Ct
- 544 Glen Ct
- 528 Glen Ct
- 207 Jenkins Way
- 592 Glen Ct Unit 37D
- 225 Jenkins Way
- 513 Joy Cir
- 106 Heather Stone Way Unit 43
- 24 Main Ave SW
- 7648 Odaniel Ct
- 7646 Odaniel Ct
- 7644 Odaniel Ct
- 7642 Odaniel Ct
- 7642 Odaniel Ct Unit 514
- 7237 Cohansey Trail
- 7640 Odaniel Ct
- 7649 Odaniel Ct
- 7651 Odaniel Ct
- 7639 Odaniel Ct
- 7732 Lexington Ct
- 7730 Lexington Ct
- 7645 Odaniel Ct
- 7734 Lexington Ct
- 7647 Odaniel Ct
- 7726 Lexington Ct
- 7728 Lexington Ct
- 7643 Odaniel Ct
- 7724 Lexington Ct
- 7641 Odaniel Ct Unit 510
Your Personal Tour Guide
Ask me questions while you tour the home.