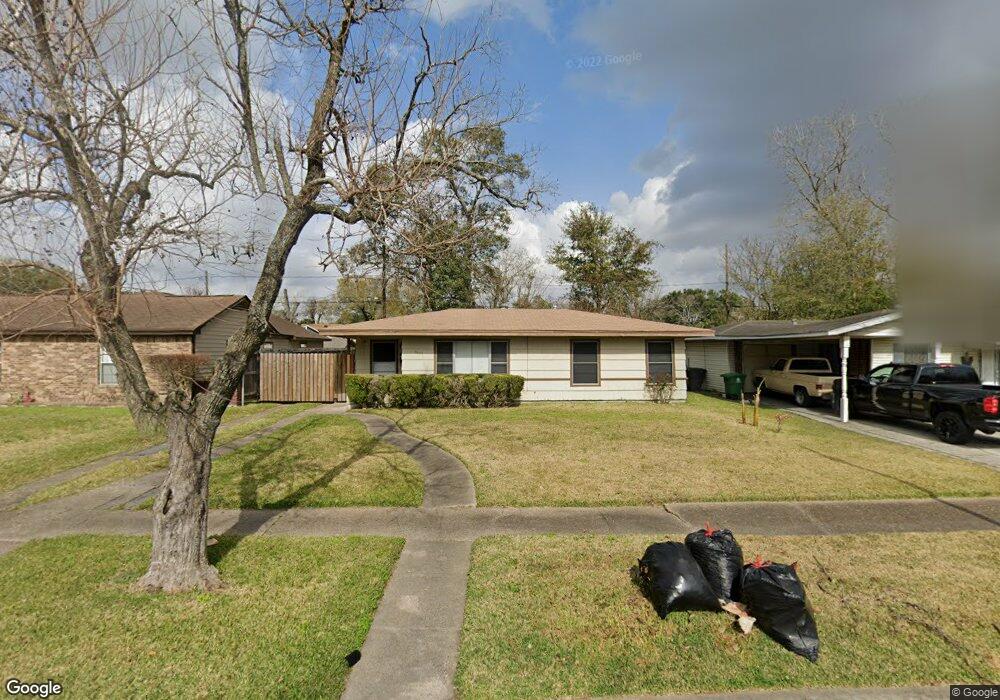
7655 El Rancho St Houston, TX 77087
Golfcrest-Bellfort-Reveille NeighborhoodEstimated Value: $134,000 - $190,000
2
Beds
1
Bath
867
Sq Ft
$188/Sq Ft
Est. Value
About This Home
This home is located at 7655 El Rancho St, Houston, TX 77087 and is currently estimated at $162,913, approximately $187 per square foot. 7655 El Rancho St is a home located in Harris County with nearby schools including Cornelius Elementary School, Hartman Middle School, and Ross Shaw Sterling Aviation High School.
Ownership History
Date
Name
Owned For
Owner Type
Purchase Details
Closed on
Jul 30, 2007
Sold by
Midfirst Bank
Bought by
Rivera Victor and Rivera Maria
Current Estimated Value
Purchase Details
Closed on
Feb 6, 2007
Sold by
Ramirez Mireya
Bought by
Midfirst Bank
Purchase Details
Closed on
Mar 28, 2000
Sold by
Wright David A
Bought by
Ramirez Mireya
Home Financials for this Owner
Home Financials are based on the most recent Mortgage that was taken out on this home.
Original Mortgage
$59,422
Interest Rate
8.37%
Mortgage Type
FHA
Purchase Details
Closed on
Dec 31, 1999
Sold by
Wright Blake
Bought by
Wright David A
Home Financials for this Owner
Home Financials are based on the most recent Mortgage that was taken out on this home.
Original Mortgage
$16,000
Interest Rate
7.69%
Mortgage Type
Seller Take Back
Create a Home Valuation Report for This Property
The Home Valuation Report is an in-depth analysis detailing your home's value as well as a comparison with similar homes in the area
Home Values in the Area
Average Home Value in this Area
Purchase History
| Date | Buyer | Sale Price | Title Company |
|---|---|---|---|
| Rivera Victor | -- | Stewart Title Houston Div | |
| Midfirst Bank | $56,454 | None Available | |
| Ramirez Mireya | -- | Texas American Title Company | |
| Wright David A | -- | -- |
Source: Public Records
Mortgage History
| Date | Status | Borrower | Loan Amount |
|---|---|---|---|
| Previous Owner | Ramirez Mireya | $59,422 | |
| Previous Owner | Wright David A | $16,000 | |
| Closed | Ramirez Mireya | $4,975 |
Source: Public Records
Tax History Compared to Growth
Tax History
| Year | Tax Paid | Tax Assessment Tax Assessment Total Assessment is a certain percentage of the fair market value that is determined by local assessors to be the total taxable value of land and additions on the property. | Land | Improvement |
|---|---|---|---|---|
| 2025 | $2,676 | $125,000 | $56,831 | $68,169 |
| 2024 | $2,676 | $127,887 | $49,727 | $78,160 |
| 2023 | $2,676 | $127,887 | $49,727 | $78,160 |
| 2022 | $2,739 | $116,440 | $49,727 | $66,713 |
| 2021 | $2,354 | $100,990 | $28,416 | $72,574 |
| 2020 | $2,156 | $83,853 | $21,312 | $62,541 |
| 2019 | $1,920 | $71,648 | $21,312 | $50,336 |
| 2018 | $1,625 | $64,236 | $21,312 | $42,924 |
| 2017 | $1,721 | $64,236 | $21,312 | $42,924 |
| 2016 | $1,534 | $57,287 | $21,312 | $35,975 |
| 2015 | $1,428 | $55,561 | $21,312 | $34,249 |
| 2014 | $1,428 | $55,561 | $21,312 | $34,249 |
Source: Public Records
Map
Nearby Homes
- 7734 El Rancho St
- 7735 Oak Vista St
- 7758 Hereford St
- 7837 Leonora St
- 7819 Leonora St
- 7908 Grove Ridge Dr
- 7936 Grove Ridge Dr
- 7954 Grove Ridge Dr
- 7909 Dixie Dr
- 7486 Stanwick Dr
- 0 Dover St Unit 39828065
- 3731 Reveille St
- 6023 Winterhaven Dr
- 7337 Moline St
- 7802 Santa Elena St
- 7659 Greenstone St
- 3607 De Leon St
- 7543 Greenstone St
- 7309 Moline St
- 7546 Greendowns St
- 7659 El Rancho St
- 7651 El Rancho St
- 7663 El Rancho St
- 7647 El Rancho St
- 7654 Dixie Dr
- 7658 Dixie Dr
- 7650 Dixie Dr
- 7662 Dixie Dr
- 7643 El Rancho St
- 7654 El Rancho St
- 7667 El Rancho St
- 7650 El Rancho St
- 7646 Dixie Dr
- 7646 El Rancho St
- 7666 Dixie Dr
- 7666 El Rancho St
- 7639 El Rancho St
- 7642 El Rancho St
- 7642 Dixie Dr
- 7638 El Rancho St