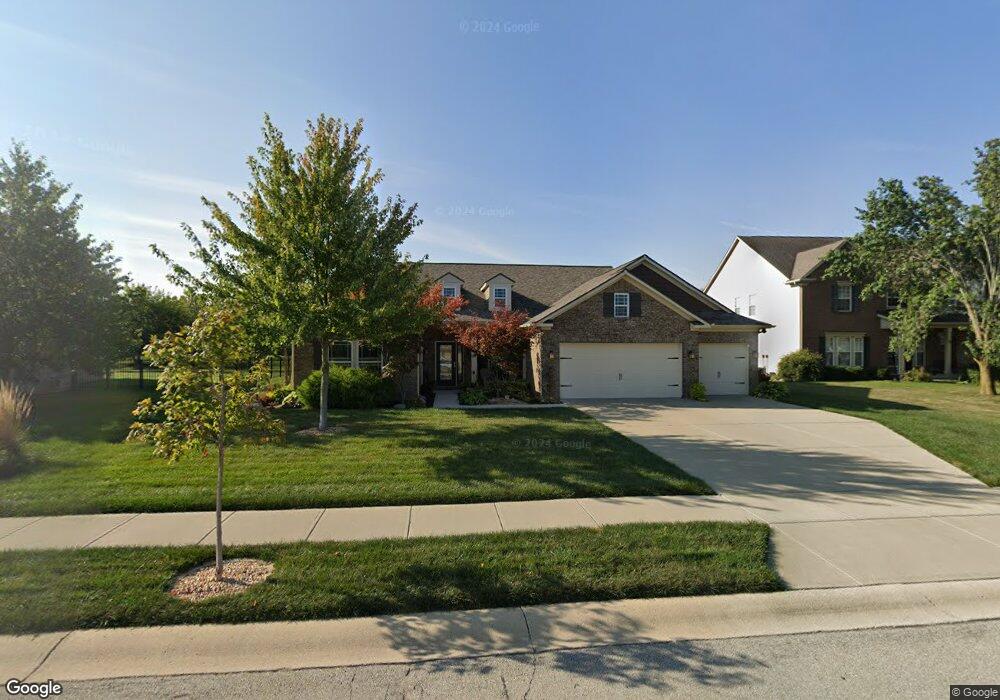
7655 Winding Lake Dr S Noblesville, IN 46062
West Noblesville NeighborhoodEstimated Value: $428,131 - $447,000
3
Beds
2
Baths
2,403
Sq Ft
$181/Sq Ft
Est. Value
About This Home
This home is located at 7655 Winding Lake Dr S, Noblesville, IN 46062 and is currently estimated at $435,783, approximately $181 per square foot. 7655 Winding Lake Dr S is a home located in Hamilton County with nearby schools including Hinkle Creek Elementary School, Noblesville West Middle School, and Noblesville High School.
Ownership History
Date
Name
Owned For
Owner Type
Purchase Details
Closed on
Feb 28, 2013
Sold by
Pyatt Builders Llc
Bought by
Thompson William P and Thompson Deborah D
Current Estimated Value
Home Financials for this Owner
Home Financials are based on the most recent Mortgage that was taken out on this home.
Original Mortgage
$203,418
Outstanding Balance
$144,066
Interest Rate
3.62%
Mortgage Type
FHA
Estimated Equity
$291,717
Purchase Details
Closed on
Jan 31, 2012
Sold by
Sterling Trust Company
Bought by
Pyatt Builders Llc
Purchase Details
Closed on
Apr 24, 2009
Sold by
Qc Houses Llc
Bought by
Sterling Trust Company
Purchase Details
Closed on
Jun 13, 2008
Sold by
Carrigan At The Levee Llc
Bought by
Bauman Raymond C
Purchase Details
Closed on
Aug 1, 2007
Sold by
Heritage Development Of Indiana Llc
Bought by
Carrigan At The Levee Llc
Create a Home Valuation Report for This Property
The Home Valuation Report is an in-depth analysis detailing your home's value as well as a comparison with similar homes in the area
Home Values in the Area
Average Home Value in this Area
Purchase History
| Date | Buyer | Sale Price | Title Company |
|---|---|---|---|
| Thompson William P | -- | None Available | |
| Pyatt Builders Llc | -- | None Available | |
| Sterling Trust Company | -- | Fat | |
| Qc Houses Llc | -- | Fat | |
| Bauman Raymond C | -- | Fat | |
| Carrigan At The Levee Llc | -- | None Available |
Source: Public Records
Mortgage History
| Date | Status | Borrower | Loan Amount |
|---|---|---|---|
| Open | Thompson William P | $203,418 |
Source: Public Records
Tax History Compared to Growth
Tax History
| Year | Tax Paid | Tax Assessment Tax Assessment Total Assessment is a certain percentage of the fair market value that is determined by local assessors to be the total taxable value of land and additions on the property. | Land | Improvement |
|---|---|---|---|---|
| 2024 | $3,364 | $271,000 | $55,000 | $216,000 |
| 2023 | $3,364 | $273,400 | $55,000 | $218,400 |
| 2022 | $3,302 | $259,500 | $55,000 | $204,500 |
| 2021 | $3,084 | $243,500 | $55,000 | $188,500 |
| 2020 | $3,091 | $237,600 | $55,000 | $182,600 |
| 2019 | $2,881 | $232,300 | $34,800 | $197,500 |
| 2018 | $2,954 | $232,500 | $34,800 | $197,700 |
| 2017 | $2,826 | $232,100 | $34,800 | $197,300 |
| 2016 | $2,820 | $234,100 | $34,800 | $199,300 |
| 2014 | $2,745 | $227,200 | $34,800 | $192,400 |
| 2013 | $2,745 | $212,300 | $34,800 | $177,500 |
Source: Public Records
Map
Nearby Homes
- 20846 Winding Lake Dr E
- 103 Edgewater Dr
- 101 Edgewater Dr
- 20798 Waterscape Way
- 20834 Waterscape Way
- 102 Clarendon Dr Unit 502
- 137 Avon Ln
- 7714 Dixon Ct
- 7175 Oakbay Dr
- 119 Wesley Cir
- 7161 Oakview Cir
- 7096 Oakbay Dr
- 108 Wesley Cir
- 7020 Oakbay Dr
- 19829 Yellow Bass Ct
- 19779 Yellow Bass Ct
- 21450 Oakview Dr
- 7596 Bluegill Dr
- 7601 Bluegill Dr
- 7595 Bluegill Dr
- 7635 Winding Lake Dr S
- 20801 Winding Lake Dr W
- 7658 Winding Lake Dr S
- 7695 Winding Lake Dr S
- 20835 Winding Lake Dr E
- 20815 Winding Lake Dr W
- 20822 Winding Lake Dr E
- 20829 Winding Lake Dr W
- 20830 Winding Lake Dr E
- 7649 Winding Lake Dr N
- 7669 Winding Lake Dr N
- 20838 Winding Lake Dr E
- 20843 Winding Lake Dr W
- 140 Edgewater Dr
- 115 Edgewater Dr
- 20857 Winding Lake Dr W
- 117 Edgewater Dr
- 20854 Winding Lake Dr E
- 119 Edgewater Dr
- 111 Edgewater Dr