7659 Cambridge St Unit 7659 Houston, TX 77054
Astrodome NeighborhoodEstimated Value: $175,942 - $209,000
2
Beds
3
Baths
1,368
Sq Ft
$143/Sq Ft
Est. Value
About This Home
This home is located at 7659 Cambridge St Unit 7659, Houston, TX 77054 and is currently estimated at $196,236, approximately $143 per square foot. 7659 Cambridge St Unit 7659 is a home located in Harris County with nearby schools including Whidby Elementary School, Cullen Middle School, and Lamar High School.
Ownership History
Date
Name
Owned For
Owner Type
Purchase Details
Closed on
Apr 28, 2017
Sold by
Wong Sonia Ming
Bought by
Ren Dewei and Shi Lizheng
Current Estimated Value
Purchase Details
Closed on
Oct 15, 2015
Sold by
Huang Li Min and Su Ying Wen
Bought by
Wong Sonia Ming
Purchase Details
Closed on
Mar 10, 2006
Sold by
Brightman Matthew
Bought by
Huang Li Min and Su Ying Wen
Purchase Details
Closed on
Jul 31, 2001
Sold by
Rao Rohini S
Bought by
Brightman Matthew
Home Financials for this Owner
Home Financials are based on the most recent Mortgage that was taken out on this home.
Original Mortgage
$76,000
Interest Rate
7.07%
Mortgage Type
Balloon
Purchase Details
Closed on
Jul 3, 1997
Sold by
Rao Janhavi S
Bought by
Rao Rohini S
Purchase Details
Closed on
Apr 1, 1994
Sold by
Rao Gujar N S and Rao Vasantha
Bought by
Rao Janhavi S
Create a Home Valuation Report for This Property
The Home Valuation Report is an in-depth analysis detailing your home's value as well as a comparison with similar homes in the area
Home Values in the Area
Average Home Value in this Area
Purchase History
| Date | Buyer | Sale Price | Title Company |
|---|---|---|---|
| Ren Dewei | -- | None Available | |
| Wong Sonia Ming | -- | None Available | |
| Huang Li Min | -- | Fidelity National Title | |
| Brightman Matthew | -- | First American Title | |
| Rao Rohini S | -- | -- | |
| Rao Janhavi S | -- | -- |
Source: Public Records
Mortgage History
| Date | Status | Borrower | Loan Amount |
|---|---|---|---|
| Previous Owner | Brightman Matthew | $76,000 | |
| Closed | Brightman Matthew | $14,250 |
Source: Public Records
Tax History Compared to Growth
Tax History
| Year | Tax Paid | Tax Assessment Tax Assessment Total Assessment is a certain percentage of the fair market value that is determined by local assessors to be the total taxable value of land and additions on the property. | Land | Improvement |
|---|---|---|---|---|
| 2025 | $4,179 | $199,725 | $37,948 | $161,777 |
| 2024 | $4,179 | $199,725 | $37,948 | $161,777 |
| 2023 | $4,179 | $187,830 | $35,688 | $152,142 |
| 2022 | $4,099 | $176,913 | $33,613 | $143,300 |
| 2021 | $4,190 | $179,772 | $34,157 | $145,615 |
| 2020 | $4,560 | $179,772 | $34,157 | $145,615 |
| 2019 | $4,644 | $175,560 | $33,356 | $142,204 |
| 2018 | $4,359 | $172,259 | $32,729 | $139,530 |
| 2017 | $4,554 | $172,259 | $32,729 | $139,530 |
| 2016 | $4,554 | $172,259 | $32,729 | $139,530 |
| 2015 | $3,685 | $155,853 | $29,612 | $126,241 |
| 2014 | $3,685 | $143,344 | $27,235 | $116,109 |
Source: Public Records
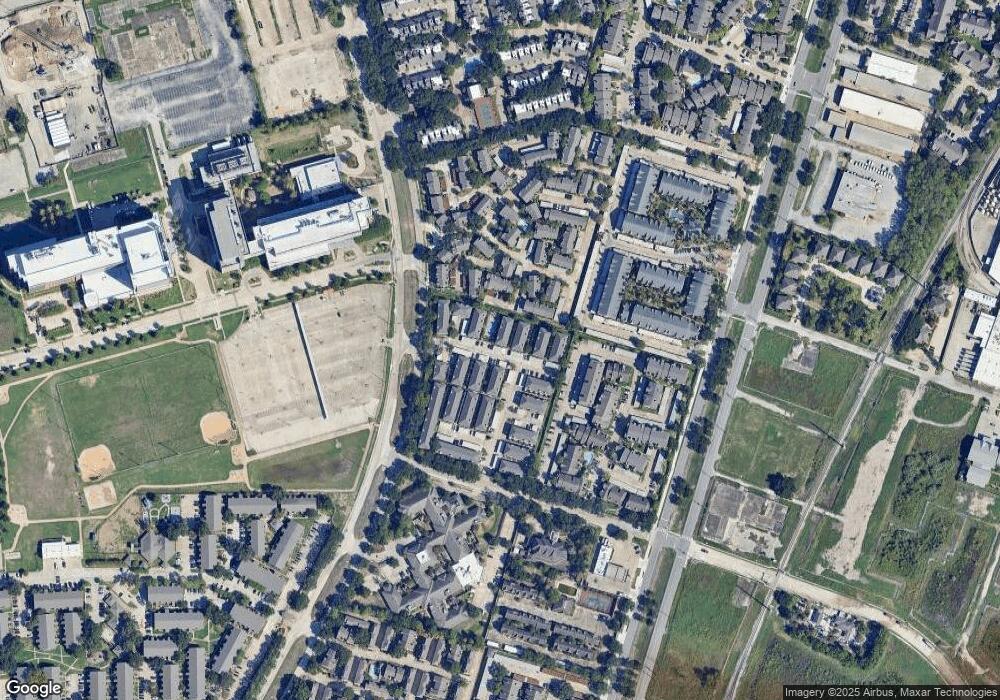
Map
Nearby Homes
- 7617 Cambridge St Unit 7617
- 7643 Cambridge St Unit 7643
- 7657 Cambridge St Unit 7657
- 7693 Cambridge St Unit 7691
- 2121 Hepburn St Unit 710
- 2121 Hepburn St Unit 208
- 2121 Hepburn St Unit 808
- 2121 Hepburn St Unit 716
- 2121 Hepburn St Unit 918
- 2121 Hepburn St Unit 905
- 7575 Cambridge St Unit 3207
- 7575 Cambridge St Unit 1604
- 7575 Cambridge St Unit 3005
- 7447 Cambridge St Unit 121
- 7447 Cambridge St Unit 71
- 7447 Cambridge St Unit 51
- 7447 Cambridge St Unit 79
- 7447 Cambridge St Unit 47
- 2300 Old Spanish Trail Unit 2004
- 2300 Old Spanish Trail Unit 1034
- 7655 Cambridge St Unit 7655
- 7653 Cambridge St Unit 7653
- 7651 Cambridge St Unit 7651
- 7649 Cambridge St Unit 7649
- 7647 Cambridge St Unit 7647
- 7645 Cambridge St Unit 7645
- 7641 Cambridge St Unit 7641
- 7779 Cambridge St Unit 7779
- 7777 Cambridge St Unit 7777
- 7775 Cambridge St Unit 7775
- 7773 Cambridge St Unit 7773
- 7771 Cambridge St Unit 7771
- 7729 Cambridge St Unit 7729
- 7789 Cambridge St Unit 7789
- 7787 Cambridge St Unit 7787
- 7785 Cambridge St Unit 7785
- 7639 Cambridge St Unit 7639
- 7783 Cambridge St Unit 7783
- 7669 Cambridge St Unit 7669
- 7669 Cambridge St