Estimated Value: $319,000 - $393,000
4
Beds
3
Baths
2,523
Sq Ft
$138/Sq Ft
Est. Value
About This Home
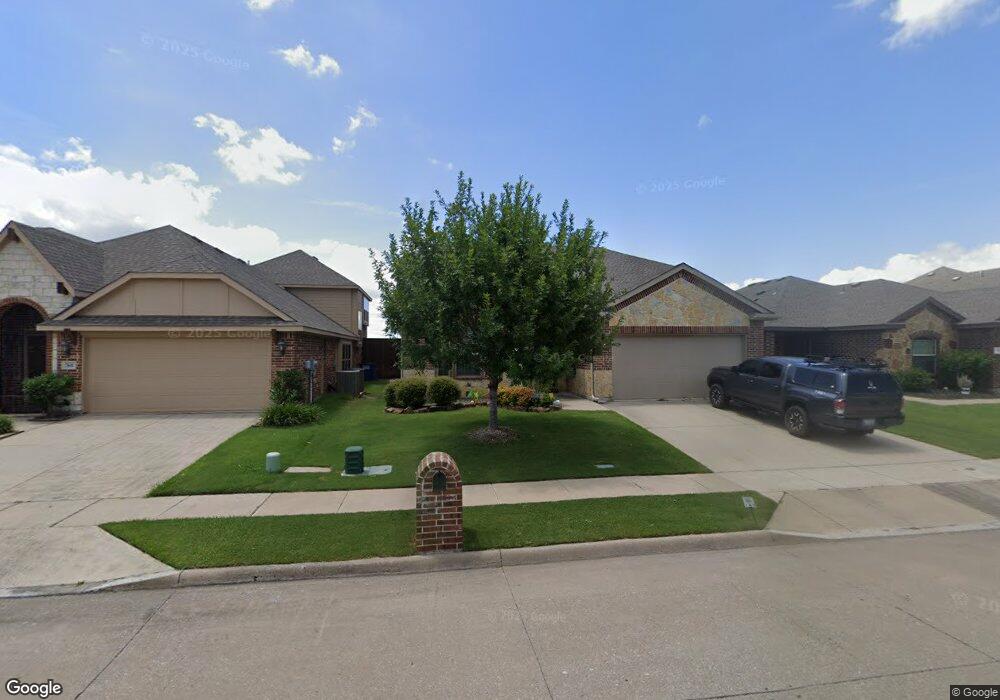
This home is located at 766 Austin Ln, Lavon, TX 75166 and is currently estimated at $348,173, approximately $137 per square foot. 766 Austin Ln is a home located in Collin County with nearby schools including Nesmith Elementary School, Community High School, and Wylie Preparatory Academy.
Ownership History
Date
Name
Owned For
Owner Type
Purchase Details
Closed on
Feb 28, 2020
Sold by
Winters Layton C and Winters Chelsea C
Bought by
Ginn Amanda and Jaeger Richard
Current Estimated Value
Home Financials for this Owner
Home Financials are based on the most recent Mortgage that was taken out on this home.
Original Mortgage
$260,200
Outstanding Balance
$229,000
Interest Rate
3.62%
Mortgage Type
FHA
Estimated Equity
$119,173
Purchase Details
Closed on
Jan 9, 2017
Sold by
D R Hoerton Texas Ltd
Bought by
Winters Layton C and Spencer Chelsea C
Home Financials for this Owner
Home Financials are based on the most recent Mortgage that was taken out on this home.
Original Mortgage
$157,091
Interest Rate
3.75%
Mortgage Type
FHA
Purchase Details
Closed on
May 11, 2009
Sold by
World Land Developers Lp
Bought by
D R Horton Texas Ltd
Create a Home Valuation Report for This Property
The Home Valuation Report is an in-depth analysis detailing your home's value as well as a comparison with similar homes in the area
Home Values in the Area
Average Home Value in this Area
Purchase History
| Date | Buyer | Sale Price | Title Company |
|---|---|---|---|
| Ginn Amanda | -- | None Available | |
| Winters Layton C | -- | None Available | |
| D R Horton Texas Ltd | -- | None Available |
Source: Public Records
Mortgage History
| Date | Status | Borrower | Loan Amount |
|---|---|---|---|
| Open | Ginn Amanda | $260,200 | |
| Previous Owner | Winters Layton C | $157,091 |
Source: Public Records
Tax History
| Year | Tax Paid | Tax Assessment Tax Assessment Total Assessment is a certain percentage of the fair market value that is determined by local assessors to be the total taxable value of land and additions on the property. | Land | Improvement |
|---|---|---|---|---|
| 2025 | $5,110 | $339,632 | $85,000 | $254,632 |
| 2024 | $6,207 | $365,572 | $85,000 | $280,572 |
| 2023 | $6,207 | $332,916 | $85,000 | $283,760 |
| 2022 | $6,376 | $302,651 | $70,000 | $267,819 |
| 2021 | $6,022 | $275,137 | $55,000 | $220,137 |
| 2020 | $6,115 | $265,471 | $55,000 | $210,471 |
| 2019 | $6,315 | $264,461 | $55,000 | $209,461 |
| 2018 | $4,048 | $172,057 | $38,500 | $133,557 |
| 2017 | $3,880 | $164,908 | $38,500 | $126,408 |
| 2016 | $3,900 | $164,536 | $28,400 | $136,136 |
| 2015 | $3,104 | $170,194 | $26,250 | $143,944 |
Source: Public Records
Map
Nearby Homes
- 891 Austin Ln
- 924 Bowie Dr
- 682 Crockett Dr
- 271 Lamar Dr
- 00000 State Highway 205
- 506 Austin Ln
- 500 Austin Ln
- TBD Hwy 78
- 707 Brookline Dr
- 1048 Mercury Dr
- 1036 Glenn Rd
- 433 Windmill Dr
- 510 Stanton Ln
- 124 Millwood Rd
- 120 Millwood Rd
- 128 Millwood Rd
- 1165 Del Rio Dr
- 136 Millwood Rd
- 1160 Del Rio Dr
- 1161 Del Rio Dr
Your Personal Tour Guide
Ask me questions while you tour the home.