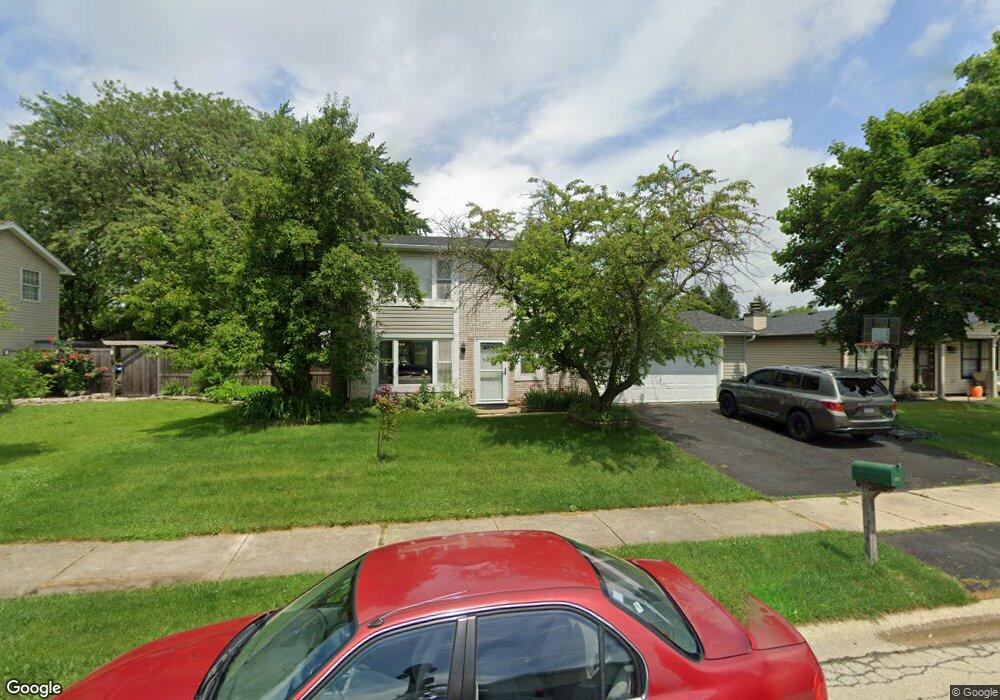
766 Bloomfield Ln Aurora, IL 60504
South East Village NeighborhoodEstimated Value: $279,000 - $355,000
3
Beds
2
Baths
1,536
Sq Ft
$210/Sq Ft
Est. Value
About This Home
This home is located at 766 Bloomfield Ln, Aurora, IL 60504 and is currently estimated at $323,104, approximately $210 per square foot. 766 Bloomfield Ln is a home located in DuPage County with nearby schools including Georgetown Elementary School, Fischer Middle School, and Waubonsie Valley High School.
Ownership History
Date
Name
Owned For
Owner Type
Purchase Details
Closed on
Apr 30, 2004
Sold by
Ramos Agustin and Ramos Gricelda
Bought by
Razo Humberto and Razo Alison
Current Estimated Value
Home Financials for this Owner
Home Financials are based on the most recent Mortgage that was taken out on this home.
Original Mortgage
$146,400
Interest Rate
4.75%
Mortgage Type
Purchase Money Mortgage
Purchase Details
Closed on
Aug 1, 2002
Sold by
Ramos Agustin and Ramos Gricelda
Bought by
Ramos Agustin and Ramos Gricelda
Home Financials for this Owner
Home Financials are based on the most recent Mortgage that was taken out on this home.
Original Mortgage
$20,000
Interest Rate
6.41%
Mortgage Type
Stand Alone Second
Purchase Details
Closed on
Dec 12, 1997
Sold by
Bratland Jay S and Bratland Michelle J
Bought by
Ramos Agustin G and Ramos Gricelda
Home Financials for this Owner
Home Financials are based on the most recent Mortgage that was taken out on this home.
Original Mortgage
$115,708
Interest Rate
7.26%
Mortgage Type
FHA
Create a Home Valuation Report for This Property
The Home Valuation Report is an in-depth analysis detailing your home's value as well as a comparison with similar homes in the area
Home Values in the Area
Average Home Value in this Area
Purchase History
| Date | Buyer | Sale Price | Title Company |
|---|---|---|---|
| Razo Humberto | $183,000 | Law Title | |
| Ramos Agustin | -- | -- | |
| Ramos Agustin G | $116,000 | -- |
Source: Public Records
Mortgage History
| Date | Status | Borrower | Loan Amount |
|---|---|---|---|
| Previous Owner | Razo Humberto | $146,400 | |
| Previous Owner | Ramos Agustin | $20,000 | |
| Previous Owner | Ramos Agustin G | $115,708 | |
| Closed | Razo Humberto | $27,450 |
Source: Public Records
Tax History Compared to Growth
Tax History
| Year | Tax Paid | Tax Assessment Tax Assessment Total Assessment is a certain percentage of the fair market value that is determined by local assessors to be the total taxable value of land and additions on the property. | Land | Improvement |
|---|---|---|---|---|
| 2024 | $6,204 | $89,600 | $22,759 | $66,841 |
| 2023 | $5,893 | $80,510 | $20,450 | $60,060 |
| 2022 | $5,624 | $73,070 | $18,410 | $54,660 |
| 2021 | $5,468 | $70,460 | $17,750 | $52,710 |
| 2020 | $5,535 | $70,460 | $17,750 | $52,710 |
| 2019 | $5,330 | $67,010 | $16,880 | $50,130 |
| 2018 | $4,577 | $57,820 | $14,450 | $43,370 |
| 2017 | $4,185 | $52,450 | $13,110 | $39,340 |
| 2016 | $4,099 | $50,330 | $12,580 | $37,750 |
| 2015 | $4,041 | $47,780 | $11,940 | $35,840 |
| 2014 | $4,255 | $48,710 | $12,080 | $36,630 |
| 2013 | $4,213 | $49,040 | $12,160 | $36,880 |
Source: Public Records
Map
Nearby Homes
- 2950 Shelly Ln Unit 2950
- 3140 Medford Ct
- 2901 Shelly Ln
- 2750 Shelly Ln
- 3131 Portland Ct
- 3132 Portland Ct
- 441 Park Ridge Ln Unit C
- 164 Park Ridge Ln
- 3467 Charlemaine Dr
- 3479 Charlemaine Dr
- 205 Churchill Ln
- 300 Churchill Ln
- 1335 Lawrence Ct
- 573 Watercress Dr
- 72 Heather Glen Dr Unit 72
- 1334 Normantown Rd Unit 334
- 1465 Bridgeport Ln Unit 19D
- 2476 Village Ct Unit 2
- 2860 Bridgeport Ln Unit 19D
- 170 Half Moon Cir
- 760 Bloomfield Ln Unit 13B
- 770 Bloomfield Ln Unit 13B
- 776 Bloomfield Ln Unit 13B
- 756 Bloomfield Ln Unit 13B
- 755 Bloomfield Ln Unit 13B
- 3120 Bloomfield Ct Unit 188
- 780 Bloomfield Ln Unit 13B
- 785 Bloomfield Ln
- 750 Bloomfield Ln
- 749 Bloomfield Ln
- 3130 Bloomfield Ct
- 719 Avondale Ln
- 795 Bloomfield Ln Unit 13B
- 786 Bloomfield Ln
- 723 Avondale Ln
- 746 Bloomfield Ln Unit 13B
- 715 Avondale Ln Unit 21
- 745 Cooper Ct E Unit 20A
- 745 Bloomfield Ln
- 3140 Bloomfield Ct Unit 13B