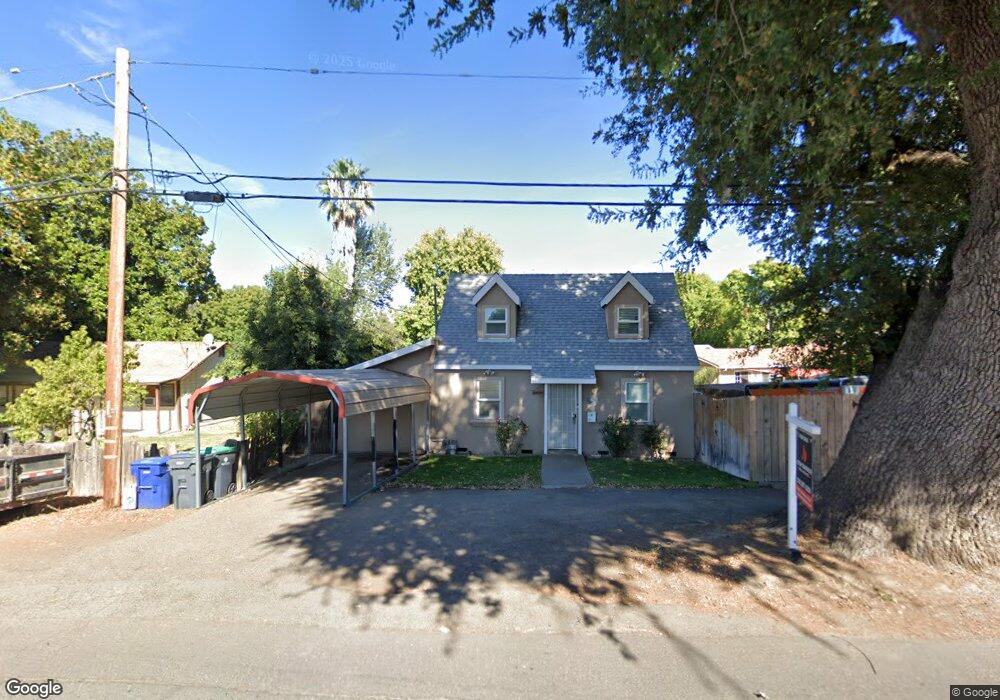
766 Lay Ave Red Bluff, CA 96080
Estimated Value: $203,000 - $269,000
About This Home
This home is located at 766 Lay Ave, Red Bluff, CA 96080 and is currently estimated at $228,554, approximately $184 per square foot. 766 Lay Ave is a home located in Tehama County with nearby schools including Jackson Heights Elementary School, Vista Preparatory Academy, and Red Bluff High School.
Ownership History
We collect this data history from publicly available records. To have your information removed, we recommend requesting removal directly through your county’s website.
Purchase Details
Home Financials for this Owner
Home Financials are based on the most recent Mortgage that was taken out on this home.Purchase Details
Purchase Details
Home Financials for this Owner
Home Financials are based on the most recent Mortgage that was taken out on this home.Purchase History
We collect this data history from publicly available records. To have your information removed, we recommend requesting removal directly through your county’s website.
| Date | Buyer | Sale Price | Title Company |
|---|---|---|---|
| -- | Placer Title Company | ||
| -- | -- | ||
| -- | Northern California Title Co | ||
| $66,000 | Northern California Title Co |
Mortgage History
We collect this data history from publicly available records. To have your information removed, we recommend requesting removal directly through your county’s website.
| Date | Status | Borrower | Loan Amount |
|---|---|---|---|
| Closed | $66,000 | ||
| Closed | $60,000 |
Tax History
We collect this data history from publicly available records. To have your information removed, we recommend requesting removal directly through your county’s website.
| Year | Tax Paid | Tax Assessment Tax Assessment Total Assessment is a certain percentage of the fair market value that is determined by local assessors to be the total taxable value of land and additions on the property. | Land | Improvement |
|---|---|---|---|---|
| 2025 | $923 | $97,478 | $23,624 | $73,854 |
| 2023 | $906 | $93,694 | $22,707 | $70,987 |
| 2022 | $898 | $91,858 | $22,262 | $69,596 |
| 2021 | $861 | $90,058 | $21,826 | $68,232 |
| 2020 | $878 | $89,136 | $21,603 | $67,533 |
| 2019 | $882 | $87,389 | $21,180 | $66,209 |
| 2018 | $815 | $85,676 | $20,765 | $64,911 |
| 2017 | $821 | $83,997 | $20,358 | $63,639 |
| 2016 | $765 | $82,351 | $19,959 | $62,392 |
| 2015 | $752 | $81,115 | $19,660 | $61,455 |
| 2014 | $740 | $79,527 | $19,275 | $60,252 |
Map
- 406 S Jackson St
- 322 Jackson St
- 355 Jackson St
- 421 Lincoln St
- 635 Armstrong Ct
- 226 Madison St
- 1002 Franzel Rd
- 532 Madison St
- 1307 Deborah Dr
- 541 Jefferson St
- 728 Lincoln St
- 0 Jefferson St Unit SN26036140
- 1405 Robinson Dr
- 855 Johnson St
- 855 Jackson St
- 415 Homestead Dr
- 1215 Wetter Way
- 1335 Franzel Rd
- 805 Hasvold Dr
- 615 Givens Rd
Ask me questions while you tour the home.