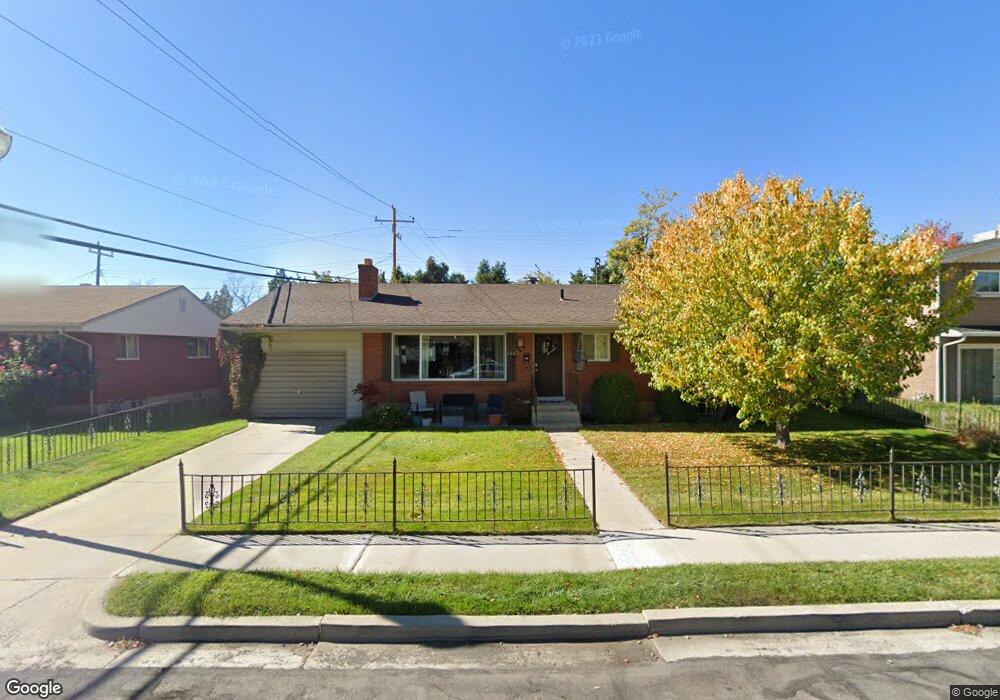
766 S 100 W Orem, UT 84058
Orem South NeighborhoodEstimated Value: $412,000 - $520,000
3
Beds
2
Baths
1,176
Sq Ft
$396/Sq Ft
Est. Value
About This Home
This home is located at 766 S 100 W, Orem, UT 84058 and is currently estimated at $466,105, approximately $396 per square foot. 766 S 100 W is a home located in Utah County with nearby schools including Westmore Elementary School, Lakeridge Jr High School, and Mountain View High School.
Ownership History
Date
Name
Owned For
Owner Type
Purchase Details
Closed on
Apr 28, 2015
Sold by
Taylor Jill C and Taylor Joseph C
Bought by
Tervort Ryan P and Tervort Jina C
Current Estimated Value
Home Financials for this Owner
Home Financials are based on the most recent Mortgage that was taken out on this home.
Original Mortgage
$142,000
Outstanding Balance
$109,352
Interest Rate
3.67%
Mortgage Type
New Conventional
Estimated Equity
$356,753
Purchase Details
Closed on
Nov 23, 2005
Sold by
Tervort Ryan Paul and Tervort Jina Colette
Bought by
Taylor Jill C and Taylor Joseph C
Home Financials for this Owner
Home Financials are based on the most recent Mortgage that was taken out on this home.
Original Mortgage
$28,200
Interest Rate
6.14%
Mortgage Type
Stand Alone Second
Purchase Details
Closed on
Oct 29, 2002
Sold by
Smith Leon G and Gibby Shirley
Bought by
Tervort Ryan Paul and Tervort Jina Colette
Home Financials for this Owner
Home Financials are based on the most recent Mortgage that was taken out on this home.
Original Mortgage
$136,999
Interest Rate
5.86%
Mortgage Type
Seller Take Back
Create a Home Valuation Report for This Property
The Home Valuation Report is an in-depth analysis detailing your home's value as well as a comparison with similar homes in the area
Home Values in the Area
Average Home Value in this Area
Purchase History
| Date | Buyer | Sale Price | Title Company |
|---|---|---|---|
| Tervort Ryan P | -- | Title West | |
| Taylor Jill C | -- | Premier Title Insurance Age | |
| Tervort Ryan Paul | -- | -- |
Source: Public Records
Mortgage History
| Date | Status | Borrower | Loan Amount |
|---|---|---|---|
| Open | Tervort Ryan P | $142,000 | |
| Previous Owner | Taylor Jill C | $28,200 | |
| Previous Owner | Taylor Jill C | $112,800 | |
| Previous Owner | Tervort Ryan Paul | $136,999 |
Source: Public Records
Tax History
| Year | Tax Paid | Tax Assessment Tax Assessment Total Assessment is a certain percentage of the fair market value that is determined by local assessors to be the total taxable value of land and additions on the property. | Land | Improvement |
|---|---|---|---|---|
| 2025 | $1,734 | $225,335 | -- | -- |
| 2024 | $1,734 | $212,025 | $0 | $0 |
| 2023 | $1,575 | $206,965 | $0 | $0 |
| 2022 | $1,798 | $228,910 | $0 | $0 |
| 2021 | $1,673 | $322,600 | $165,000 | $157,600 |
| 2020 | $1,512 | $286,500 | $132,000 | $154,500 |
| 2019 | $1,329 | $261,900 | $121,900 | $140,000 |
| 2018 | $1,214 | $228,600 | $105,000 | $123,600 |
| 2017 | $1,093 | $110,220 | $0 | $0 |
| 2016 | $1,073 | $99,825 | $0 | $0 |
| 2015 | $1,040 | $91,520 | $0 | $0 |
| 2014 | $985 | $86,295 | $0 | $0 |
Source: Public Records
Map
Nearby Homes
Your Personal Tour Guide
Ask me questions while you tour the home.