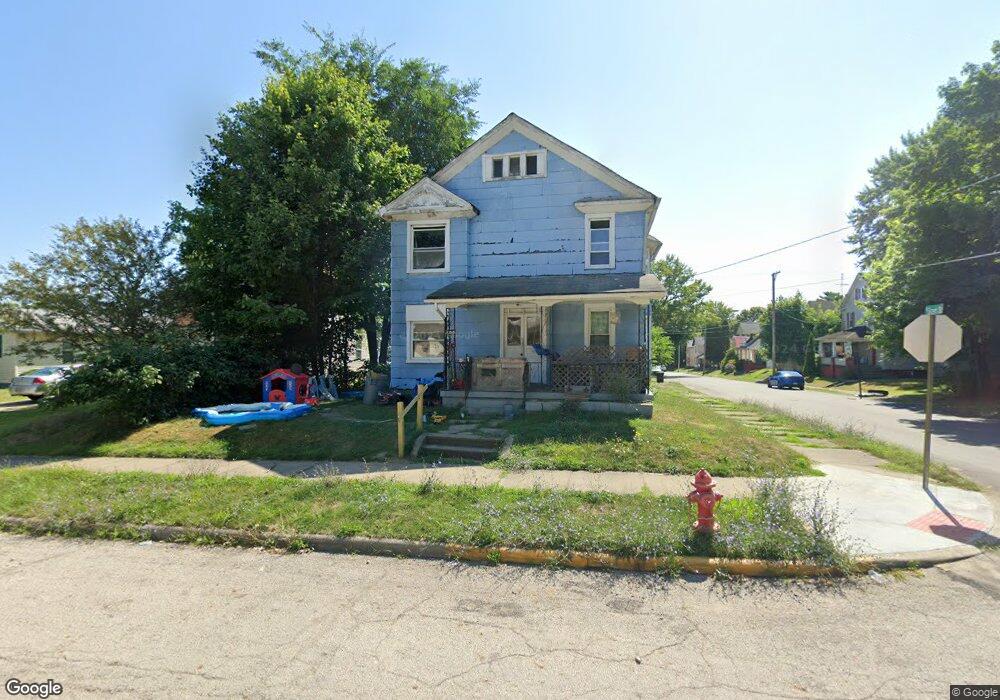
766 S Freedom Ave Alliance, OH 44601
Estimated Value: $60,000 - $98,699
4
Beds
2
Baths
1,926
Sq Ft
$42/Sq Ft
Est. Value
About This Home
This home is located at 766 S Freedom Ave, Alliance, OH 44601 and is currently estimated at $80,425, approximately $41 per square foot. 766 S Freedom Ave is a home located in Stark County with nearby schools including Alliance Elementary School at Rockhill, Alliance Intermediate School at Northside, and Alliance Middle School.
Ownership History
Date
Name
Owned For
Owner Type
Purchase Details
Closed on
Nov 18, 2019
Sold by
Zinkhon Joyce A
Bought by
Byers Howard L and Byers Sharon G
Current Estimated Value
Purchase Details
Closed on
Jan 29, 2010
Sold by
Zinkhon John M and Zinkhon Joyce A
Bought by
Byers Howard L and Byers Sharon G
Home Financials for this Owner
Home Financials are based on the most recent Mortgage that was taken out on this home.
Original Mortgage
$35,000
Interest Rate
8%
Mortgage Type
Seller Take Back
Purchase Details
Closed on
Dec 17, 2004
Sold by
Ketler Nona M and Ketler Richard A
Bought by
Zinkhon John M and Zinkhon Joyce A
Purchase Details
Closed on
Dec 14, 2004
Sold by
Wike Donald M
Bought by
Zinkhon John M and Zinkhon Joyce A
Purchase Details
Closed on
Dec 9, 2004
Sold by
Wike Ronald E and Wike Hariett E
Bought by
Zinkhon John M and Zinkhon Joyce A
Create a Home Valuation Report for This Property
The Home Valuation Report is an in-depth analysis detailing your home's value as well as a comparison with similar homes in the area
Home Values in the Area
Average Home Value in this Area
Purchase History
| Date | Buyer | Sale Price | Title Company |
|---|---|---|---|
| Byers Howard L | $35,000 | None Available | |
| Byers Howard L | $35,000 | Attorney | |
| Zinkhon John M | $3,400 | -- | |
| Zinkhon John M | $3,400 | -- | |
| Zinkhon John M | $3,400 | -- | |
| Zinkhon John M | $3,400 | -- |
Source: Public Records
Mortgage History
| Date | Status | Borrower | Loan Amount |
|---|---|---|---|
| Previous Owner | Byers Howard L | $35,000 |
Source: Public Records
Tax History Compared to Growth
Tax History
| Year | Tax Paid | Tax Assessment Tax Assessment Total Assessment is a certain percentage of the fair market value that is determined by local assessors to be the total taxable value of land and additions on the property. | Land | Improvement |
|---|---|---|---|---|
| 2025 | $2,956 | $23,490 | $3,850 | $19,640 |
| 2024 | $1,854 | $23,490 | $3,850 | $19,640 |
| 2023 | $1,805 | $11,660 | $1,960 | $9,700 |
| 2022 | $483 | $11,660 | $1,960 | $9,700 |
| 2021 | $484 | $11,660 | $1,960 | $9,700 |
| 2020 | $446 | $10,020 | $1,720 | $8,300 |
| 2019 | $440 | $10,020 | $1,720 | $8,300 |
| 2018 | $442 | $10,020 | $1,720 | $8,300 |
| 2017 | $398 | $8,860 | $1,440 | $7,420 |
| 2016 | $401 | $8,860 | $1,440 | $7,420 |
| 2015 | $404 | $8,860 | $1,440 | $7,420 |
| 2014 | $239 | $4,980 | $1,370 | $3,610 |
| 2013 | $119 | $4,980 | $1,370 | $3,610 |
Source: Public Records
Map
Nearby Homes
- 452 E Summit St
- 1005 S Freedom Ave
- 1044 S Liberty Ave
- 814 Milner St
- 432 S Linden Ave
- 442 S Liberty Ave
- 1175 S Freedom Ave
- 831 Wade Ave
- V/L S Fredeom Ave
- 551 South St
- 356 E Broadway St
- 807 S Union Ave
- 1395 S Webb Ave
- 729 Waugh St
- 1437 S Linden Ave
- 427 S Union Ave
- 1233 Woodland Ave
- 361 E Main St
- 815 Grace St
- 140 W Summit St
- 756 S Freedom Ave
- 530 E Grant St
- 808 S Freedom Ave
- 750 S Freedom Ave
- 527 E Grant St
- 767 S Freedom Ave
- 536 E Grant St
- 818 S Freedom Ave
- 736 S Freedom Ave
- 805 S Freedom Ave
- 757 S Freedom Ave
- 537 E Grant St
- 747 S Seneca Ave
- 749 S Freedom Ave
- 545 E Grant St
- 755 S Seneca Ave
- 830 S Freedom Ave
- 544 E Grant St
- 724 S Freedom Ave
- 815 S Freedom Ave