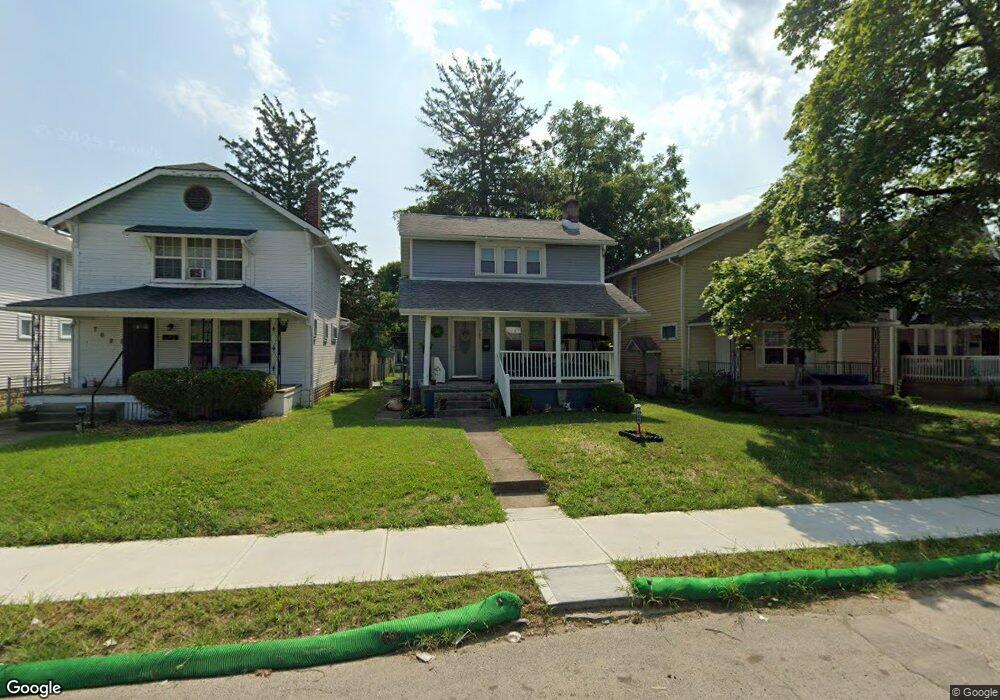
766 S Richardson Ave Columbus, OH 43204
South Central Hilltop NeighborhoodEstimated Value: $117,000 - $145,000
2
Beds
1
Bath
1,126
Sq Ft
$117/Sq Ft
Est. Value
About This Home
This home is located at 766 S Richardson Ave, Columbus, OH 43204 and is currently estimated at $132,053, approximately $117 per square foot. 766 S Richardson Ave is a home located in Franklin County with nearby schools including Lindbergh Elementary School, Hilltonia Middle School, and Briggs High School.
Ownership History
Date
Name
Owned For
Owner Type
Purchase Details
Closed on
Jul 16, 2008
Sold by
Central Mortgage Co
Bought by
Richards David and Richards Lucinda
Current Estimated Value
Purchase Details
Closed on
Apr 3, 2008
Sold by
Hightower Wilson Cheryl L and Case #07Cve08 10658
Bought by
Central Mortgage Co
Purchase Details
Closed on
Sep 7, 2005
Sold by
Beneficial Ohio Inc
Bought by
Wilson Gary and Hightower Wilson Cheryl L
Home Financials for this Owner
Home Financials are based on the most recent Mortgage that was taken out on this home.
Original Mortgage
$40,800
Interest Rate
8.37%
Mortgage Type
Fannie Mae Freddie Mac
Purchase Details
Closed on
Apr 6, 2005
Sold by
Fout Charmaine A and Case #04Cve10 10787
Bought by
Beneficial Ohio Inc and Beneficial Mortgage Co Of Ohio
Purchase Details
Closed on
Jun 13, 1989
Bought by
Fout Charmaine A
Create a Home Valuation Report for This Property
The Home Valuation Report is an in-depth analysis detailing your home's value as well as a comparison with similar homes in the area
Home Values in the Area
Average Home Value in this Area
Purchase History
| Date | Buyer | Sale Price | Title Company |
|---|---|---|---|
| Richards David | $16,100 | Hummel Titl | |
| Central Mortgage Co | $36,000 | Ohio Title | |
| Wilson Gary | $51,000 | Foundation | |
| Beneficial Ohio Inc | $45,000 | Public Squ | |
| Fout Charmaine A | $30,000 | -- |
Source: Public Records
Mortgage History
| Date | Status | Borrower | Loan Amount |
|---|---|---|---|
| Previous Owner | Wilson Gary | $40,800 |
Source: Public Records
Tax History Compared to Growth
Tax History
| Year | Tax Paid | Tax Assessment Tax Assessment Total Assessment is a certain percentage of the fair market value that is determined by local assessors to be the total taxable value of land and additions on the property. | Land | Improvement |
|---|---|---|---|---|
| 2024 | $1,697 | $37,030 | $5,250 | $31,780 |
| 2023 | $1,747 | $37,030 | $5,250 | $31,780 |
| 2022 | $670 | $12,600 | $2,100 | $10,500 |
| 2021 | $671 | $12,600 | $2,100 | $10,500 |
| 2020 | $794 | $12,600 | $2,100 | $10,500 |
| 2019 | $653 | $10,500 | $1,750 | $8,750 |
| 2018 | $836 | $10,500 | $1,750 | $8,750 |
| 2017 | $1,174 | $17,610 | $1,750 | $15,860 |
| 2016 | $1,099 | $15,440 | $2,490 | $12,950 |
| 2015 | $1,021 | $15,440 | $2,490 | $12,950 |
| 2014 | $957 | $15,440 | $2,490 | $12,950 |
| 2013 | $556 | $18,165 | $2,940 | $15,225 |
Source: Public Records
Map
Nearby Homes
- 734 S Richardson Ave
- 727 S Richardson Ave
- 811 S Richardson Ave
- 730 S Burgess Ave
- 2585 Eakin Rd
- 2579 Eakin Rd
- 651 S Terrace Ave
- 815 S Wayne Ave
- 724 S Eureka Ave
- 2538 Vanderberg Ave
- 2530 Vanderberg Ave
- 693 S Wayne Ave
- 678 S Warren Ave
- 2687 Vanderberg Ave
- 599 S Burgess Ave Unit 601
- 2491 Vanderberg Ave
- 677 S Warren Ave
- 805 S Warren Ave
- 2588 Regina Ave
- 790 Racine Ave
- 770 S Richardson Ave
- 762 S Richardson Ave
- 774 S Richardson Ave
- 756 S Richardson Ave
- 752 S Richardson Ave
- 748 S Richardson Ave
- 784 S Richardson Ave
- 775 S Terrace Ave
- 779 S Terrace Ave
- 790 S Richardson Ave
- 769 S Terrace Ave
- 785 S Terrace Ave
- 740 S Richardson Ave
- 765 S Terrace Ave
- 763 S Richardson Ave
- 767 S Richardson Ave
- 759 S Richardson Ave
- 794 S Richardson Ave
- 771 S Richardson Ave
- 755 S Richardson Ave