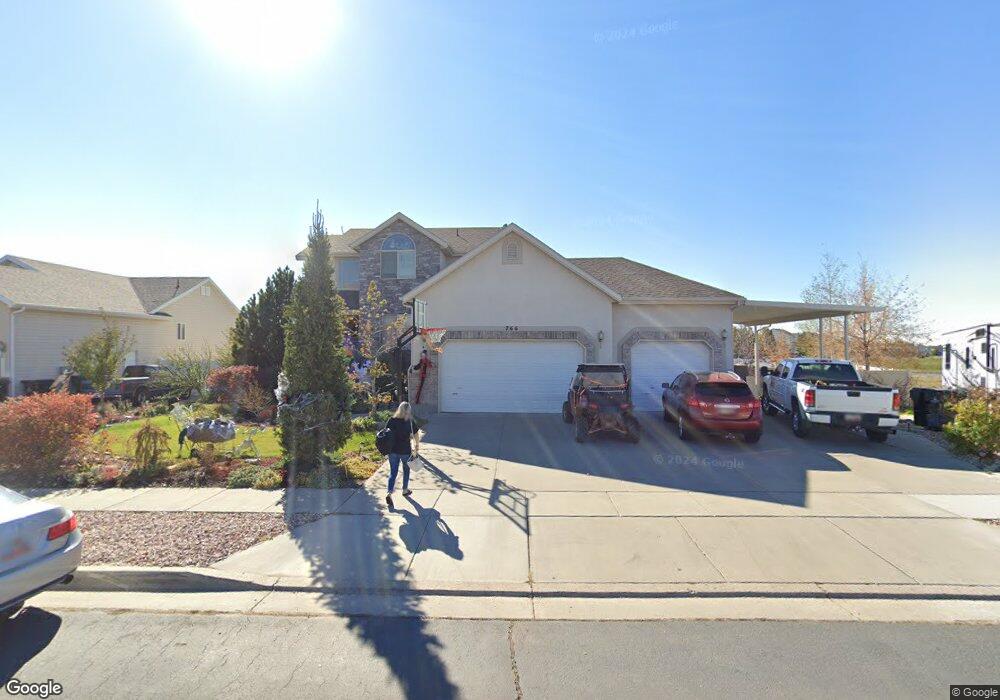
766 Saint Andrews Dr Syracuse, UT 84075
Estimated Value: $578,000 - $644,000
3
Beds
3
Baths
2,736
Sq Ft
$218/Sq Ft
Est. Value
About This Home
This home is located at 766 Saint Andrews Dr, Syracuse, UT 84075 and is currently estimated at $596,762, approximately $218 per square foot. 766 Saint Andrews Dr is a home located in Davis County with nearby schools including Buffalo Point School, Syracuse Junior High School, and Syracuse High School.
Ownership History
Date
Name
Owned For
Owner Type
Purchase Details
Closed on
Apr 24, 2013
Sold by
Kobaly Christopher S and Kobaly Tanya
Bought by
Child Tice D and Child Jamie K
Current Estimated Value
Home Financials for this Owner
Home Financials are based on the most recent Mortgage that was taken out on this home.
Original Mortgage
$250,230
Outstanding Balance
$177,664
Interest Rate
3.6%
Mortgage Type
New Conventional
Estimated Equity
$419,098
Purchase Details
Closed on
Nov 10, 2011
Sold by
Kobaly Christopher S
Bought by
Kobaly Christopher S and Kobaly Tanya
Home Financials for this Owner
Home Financials are based on the most recent Mortgage that was taken out on this home.
Original Mortgage
$246,009
Interest Rate
3.87%
Mortgage Type
VA
Purchase Details
Closed on
Feb 6, 2008
Sold by
Kobaly Christopher S
Bought by
Kobaly Christopher S and Kobaly Tanya
Home Financials for this Owner
Home Financials are based on the most recent Mortgage that was taken out on this home.
Original Mortgage
$249,390
Interest Rate
6.17%
Mortgage Type
VA
Purchase Details
Closed on
Oct 25, 2006
Sold by
Kobaly Christopher S
Bought by
Kobaly Christopher S and Kobaly Tanya
Home Financials for this Owner
Home Financials are based on the most recent Mortgage that was taken out on this home.
Original Mortgage
$247,100
Interest Rate
6.3%
Mortgage Type
VA
Purchase Details
Closed on
Oct 24, 2006
Sold by
Mcclellan Sean
Bought by
Kobaly Christopher S
Home Financials for this Owner
Home Financials are based on the most recent Mortgage that was taken out on this home.
Original Mortgage
$247,100
Interest Rate
6.3%
Mortgage Type
VA
Purchase Details
Closed on
Aug 23, 2005
Sold by
Dennis Higley Inc
Bought by
Wanczyk Treasure
Home Financials for this Owner
Home Financials are based on the most recent Mortgage that was taken out on this home.
Original Mortgage
$167,157
Interest Rate
6.5%
Mortgage Type
Fannie Mae Freddie Mac
Purchase Details
Closed on
Jan 11, 2005
Sold by
Dennis Higely Inc
Bought by
Mcclellan Seah
Home Financials for this Owner
Home Financials are based on the most recent Mortgage that was taken out on this home.
Original Mortgage
$199,500
Interest Rate
6.15%
Mortgage Type
New Conventional
Purchase Details
Closed on
Apr 12, 2004
Sold by
Blackburn Jones Real Estate Inc
Bought by
Dennis Higley Inc and Dhi Construction
Create a Home Valuation Report for This Property
The Home Valuation Report is an in-depth analysis detailing your home's value as well as a comparison with similar homes in the area
Home Values in the Area
Average Home Value in this Area
Purchase History
| Date | Buyer | Sale Price | Title Company |
|---|---|---|---|
| Child Tice D | -- | Us Title Company | |
| Kobaly Christopher S | -- | Mountain View Title | |
| Kobaly Christopher S | -- | Mountain View Title | |
| Kobaly Christopher S | -- | Accommodation | |
| Kobaly Christopher S | -- | Mountain View Title & Escrow | |
| Kobaly Christopher S | -- | Mountain View Title & Escrow | |
| Kobaly Christopher S | -- | Equity Title Ins Agency Inc | |
| Wanczyk Treasure | -- | Equity Title Ins Agency Inc | |
| Mcclellan Seah | -- | None Available | |
| Mcclellan Sean | -- | Equity Title Ins Agency Inc | |
| Dennis Higley Inc | -- | First American Title Co |
Source: Public Records
Mortgage History
| Date | Status | Borrower | Loan Amount |
|---|---|---|---|
| Open | Child Tice D | $250,230 | |
| Previous Owner | Kobaly Christopher S | $246,009 | |
| Previous Owner | Kobaly Christopher S | $249,390 | |
| Previous Owner | Kobaly Christopher S | $247,100 | |
| Previous Owner | Wanczyk Treasure | $167,157 | |
| Previous Owner | Mcclellan Sean | $199,500 |
Source: Public Records
Tax History Compared to Growth
Tax History
| Year | Tax Paid | Tax Assessment Tax Assessment Total Assessment is a certain percentage of the fair market value that is determined by local assessors to be the total taxable value of land and additions on the property. | Land | Improvement |
|---|---|---|---|---|
| 2025 | $2,907 | $280,500 | $111,515 | $168,985 |
| 2024 | $2,780 | $270,050 | $90,993 | $179,057 |
| 2023 | $2,706 | $479,000 | $136,105 | $342,895 |
| 2022 | $2,925 | $283,800 | $69,265 | $214,535 |
| 2021 | $2,663 | $400,000 | $100,848 | $299,152 |
| 2020 | $2,407 | $350,000 | $82,497 | $267,503 |
| 2019 | $2,382 | $342,000 | $85,722 | $256,278 |
| 2018 | $2,197 | $313,000 | $83,017 | $229,983 |
| 2016 | $1,956 | $146,135 | $34,176 | $111,959 |
| 2015 | $1,986 | $141,350 | $34,176 | $107,174 |
| 2014 | $1,831 | $132,781 | $34,176 | $98,605 |
| 2013 | -- | $124,335 | $31,917 | $92,418 |
Source: Public Records
Map
Nearby Homes
- 851 S 3525 W
- 3565 W 800 S
- 3649 W 800 S
- 3661 W 800 S
- 895 Dunes Dr
- 3627 W Augusta Dr
- 3736 W 1225 S
- 3867 Rungsted Cir
- 4105 W 550 S
- 835 S Criddle Rd
- 3951 Baltimore Cir
- 3564 Princeville Dr
- 1441 Brookshire Dr
- 1084 S 4090 W
- 3882 Turnberry Dr
- 4244 W 625 S
- 2840 W 1200 S
- 1039 S 4250 W
- 3849 W 50 S Unit 426
- 3851 W 50 S Unit 425
- 766 St Andrews Dr
- 780 St Andrews Dr
- 795 S 3525 W
- 780 Saint Andrews Dr
- 765 St Andrews Dr
- 794 Saint Andrews Dr
- 765 Saint Andrews Dr
- 777 St Andrews Dr
- 815 S 3525 W
- 777 Saint Andrews Dr
- 827 S 3525 W
- 741 St Andrews Dr
- 741 St Andrews Dr
- 741 Saint Andrews Dr
- 791 St Andrews Dr
- 806 Saint Andrews Dr
- 791 Saint Andrews Dr
- 844 Jupiter Hills Cir
- 839 S 3525 W
- 3541 W 800 S