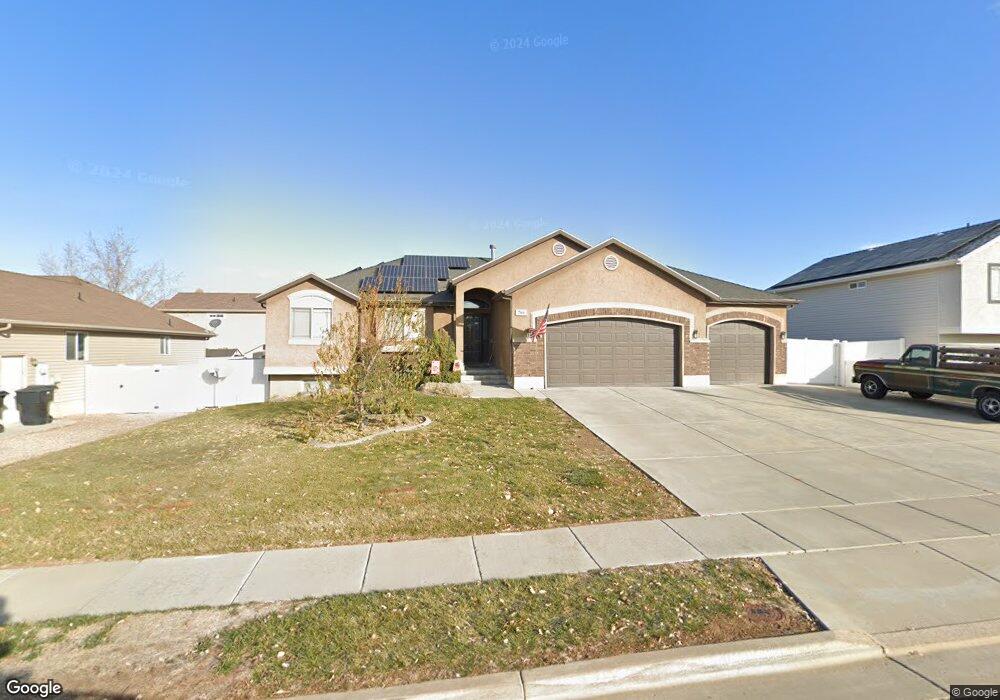
766 W 1090 N Clearfield, UT 84015
Estimated Value: $491,000 - $541,000
3
Beds
2
Baths
2,884
Sq Ft
$179/Sq Ft
Est. Value
About This Home
This home is located at 766 W 1090 N, Clearfield, UT 84015 and is currently estimated at $516,472, approximately $179 per square foot. 766 W 1090 N is a home located in Davis County with nearby schools including Clinton Elementary School, Sunset Junior High School, and Clearfield High School.
Ownership History
Date
Name
Owned For
Owner Type
Purchase Details
Closed on
Aug 25, 2022
Sold by
Armstrong William D A
Bought by
Bill And Audrie Armstrong Joint Family Trust
Current Estimated Value
Purchase Details
Closed on
Feb 1, 2016
Sold by
Armstrong William D A and Armstrong Kebdra Lynn
Bought by
Armstrong William D
Purchase Details
Closed on
Apr 27, 2012
Sold by
Armstrong William D A
Bought by
Armstrong William D and Armstrong Kendra Lynn
Home Financials for this Owner
Home Financials are based on the most recent Mortgage that was taken out on this home.
Original Mortgage
$215,000
Interest Rate
3.94%
Mortgage Type
VA
Purchase Details
Closed on
May 15, 2007
Sold by
Freemont Investments Llc
Bought by
Pace Brock T
Home Financials for this Owner
Home Financials are based on the most recent Mortgage that was taken out on this home.
Original Mortgage
$200,000
Interest Rate
5.83%
Mortgage Type
Purchase Money Mortgage
Purchase Details
Closed on
May 19, 2006
Sold by
Rock Island Investments Lp
Bought by
Freemont Investments Llc
Purchase Details
Closed on
Jan 23, 2004
Sold by
Freemont Investments Llc
Bought by
Rock Island Investments Lp
Home Financials for this Owner
Home Financials are based on the most recent Mortgage that was taken out on this home.
Original Mortgage
$200,000
Interest Rate
5.86%
Mortgage Type
Stand Alone Second
Purchase Details
Closed on
Jan 16, 2004
Sold by
Faerber David M
Bought by
Freemont Investments Llc
Home Financials for this Owner
Home Financials are based on the most recent Mortgage that was taken out on this home.
Original Mortgage
$200,000
Interest Rate
5.86%
Mortgage Type
Stand Alone Second
Create a Home Valuation Report for This Property
The Home Valuation Report is an in-depth analysis detailing your home's value as well as a comparison with similar homes in the area
Home Values in the Area
Average Home Value in this Area
Purchase History
| Date | Buyer | Sale Price | Title Company |
|---|---|---|---|
| Bill And Audrie Armstrong Joint Family Trust | -- | None Listed On Document | |
| Armstrong William D | -- | -- | |
| Armstrong William D | -- | American Preferred | |
| Armstrong William D A | -- | Bonneville Superior Title Co | |
| Pace Brock T | -- | Bonneville Superior Title Co | |
| Freemont Investments Llc | -- | Bonneville Title Company | |
| Rock Island Investments Lp | -- | Bonneville Title Company Inc | |
| Freemont Investments Llc | -- | Bonneville Title Company Inc | |
| Freemont Investments Llc | -- | Bonneville Title Company Inc |
Source: Public Records
Mortgage History
| Date | Status | Borrower | Loan Amount |
|---|---|---|---|
| Previous Owner | Armstrong William D A | $215,000 | |
| Previous Owner | Pace Brock T | $200,000 | |
| Previous Owner | Freemont Investments Llc | $200,000 |
Source: Public Records
Tax History Compared to Growth
Tax History
| Year | Tax Paid | Tax Assessment Tax Assessment Total Assessment is a certain percentage of the fair market value that is determined by local assessors to be the total taxable value of land and additions on the property. | Land | Improvement |
|---|---|---|---|---|
| 2025 | -- | $278,300 | $88,773 | $189,527 |
| 2024 | -- | $268,400 | $97,742 | $170,658 |
| 2023 | $737 | $463,000 | $110,923 | $352,077 |
| 2022 | $737 | $271,700 | $68,201 | $203,499 |
| 2021 | $55 | $359,000 | $84,789 | $274,211 |
| 2020 | $1,809 | $310,000 | $71,735 | $238,265 |
| 2019 | $1,809 | $290,000 | $84,406 | $205,594 |
| 2018 | $0 | $270,000 | $71,368 | $198,632 |
| 2016 | $1,831 | $131,835 | $27,726 | $104,109 |
| 2015 | $1,860 | $127,325 | $27,726 | $99,599 |
| 2014 | $1,697 | $118,000 | $27,726 | $90,274 |
| 2013 | $1,770 | $121,266 | $27,143 | $94,123 |
Source: Public Records
Map
Nearby Homes