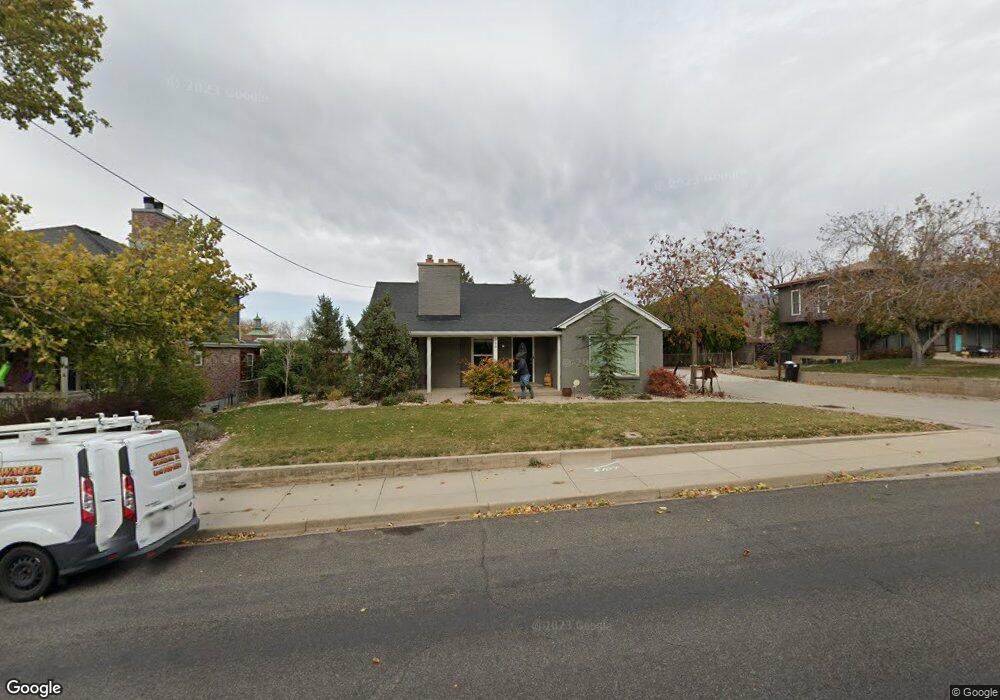
766 W 3800 S Bountiful, UT 84010
Estimated Value: $646,000 - $785,000
5
Beds
3
Baths
3,430
Sq Ft
$204/Sq Ft
Est. Value
About This Home
This home is located at 766 W 3800 S, Bountiful, UT 84010 and is currently estimated at $700,712, approximately $204 per square foot. 766 W 3800 S is a home located in Davis County with nearby schools including Adelaide School, South Davis Junior High School, and Woods Cross High School.
Ownership History
Date
Name
Owned For
Owner Type
Purchase Details
Closed on
Dec 17, 2019
Sold by
Glaittli Penelope A
Bought by
Glaittli Jeffrey G
Current Estimated Value
Home Financials for this Owner
Home Financials are based on the most recent Mortgage that was taken out on this home.
Original Mortgage
$300,000
Outstanding Balance
$263,923
Interest Rate
3.6%
Mortgage Type
New Conventional
Estimated Equity
$436,789
Purchase Details
Closed on
Jan 31, 2014
Sold by
Allgood Teddy Anne Studniarz
Bought by
Murff Jesse P
Purchase Details
Closed on
Jul 16, 2013
Sold by
Allgood Teddy Anne S
Bought by
Studniarz Allgood Teddy Anne
Purchase Details
Closed on
Feb 22, 2011
Sold by
Studniarz Thaddeus
Bought by
Studniarz Thaddeus
Create a Home Valuation Report for This Property
The Home Valuation Report is an in-depth analysis detailing your home's value as well as a comparison with similar homes in the area
Home Values in the Area
Average Home Value in this Area
Purchase History
| Date | Buyer | Sale Price | Title Company |
|---|---|---|---|
| Glaittli Jeffrey G | -- | Backman Title Services | |
| Murff Jesse P | -- | None Available | |
| Studniarz Allgood Teddy Anne | -- | None Available | |
| Studniarz Thaddeus | -- | None Available |
Source: Public Records
Mortgage History
| Date | Status | Borrower | Loan Amount |
|---|---|---|---|
| Open | Glaittli Jeffrey G | $300,000 |
Source: Public Records
Tax History Compared to Growth
Tax History
| Year | Tax Paid | Tax Assessment Tax Assessment Total Assessment is a certain percentage of the fair market value that is determined by local assessors to be the total taxable value of land and additions on the property. | Land | Improvement |
|---|---|---|---|---|
| 2025 | $4,205 | $370,150 | $178,081 | $192,069 |
| 2024 | $3,822 | $340,449 | $175,641 | $164,808 |
| 2023 | $3,793 | $335,500 | $169,065 | $166,434 |
| 2022 | $3,735 | $640,000 | $297,765 | $342,235 |
| 2021 | $3,483 | $499,000 | $214,972 | $284,028 |
| 2020 | $3,269 | $458,000 | $178,083 | $279,917 |
| 2019 | $2,943 | $403,000 | $154,334 | $248,666 |
| 2018 | $2,750 | $376,000 | $150,590 | $225,410 |
| 2016 | $1,918 | $152,240 | $67,563 | $84,677 |
| 2015 | $1,967 | $141,460 | $67,563 | $73,897 |
| 2014 | $1,863 | $139,177 | $67,379 | $71,798 |
| 2013 | -- | $119,668 | $42,187 | $77,481 |
Source: Public Records
Map
Nearby Homes
- 246 N Glenwood Way
- 3573 S Highway 89
- 252 E Kirsten Ln
- 200 Cobble Creek Rd
- 410 N 175 E
- 757 W 3200 S
- 2420 S Orchard Dr
- 178 N Valley View Dr
- 562 Lancelot Dr Unit 60
- 626 Sagramore St
- 189 E 210 N Unit 8
- 284 N 100 E
- 174 Pellinore St
- 3238 S 675 W
- 244 Odell Lane 100 N
- 638 Scenic Hills Dr
- 167 Guenevere St Unit 128
- 621 Excalibur St Unit 143
- 105 Wilson Rd
- 286 Lionel St