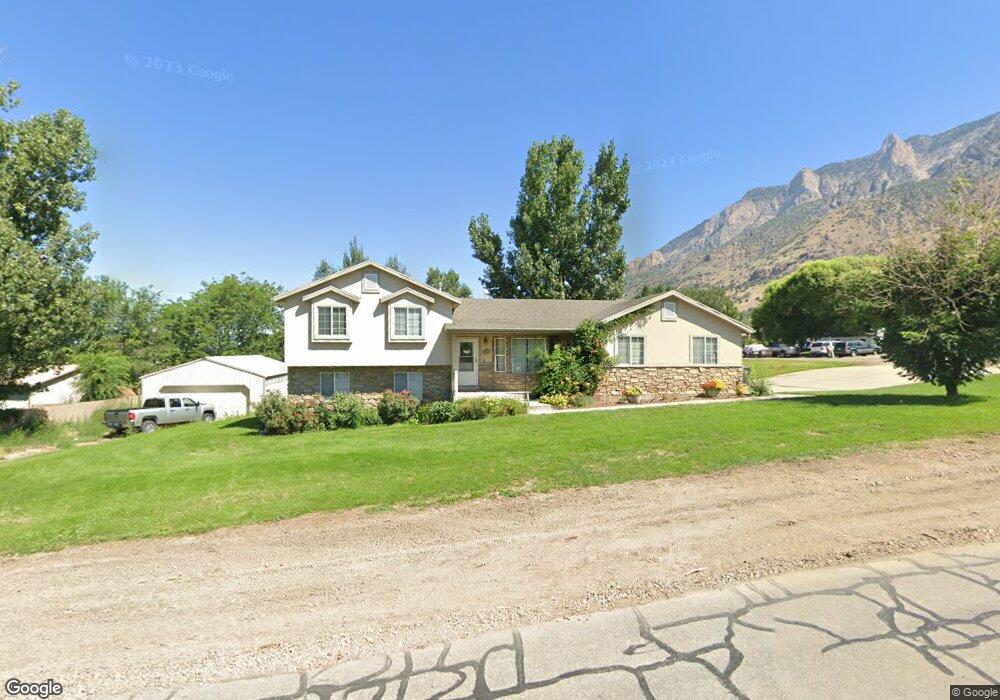
766 W 7325 S Willard, UT 84340
Estimated Value: $520,000 - $639,000
4
Beds
3
Baths
2,585
Sq Ft
$229/Sq Ft
Est. Value
About This Home
This home is located at 766 W 7325 S, Willard, UT 84340 and is currently estimated at $590,749, approximately $228 per square foot. 766 W 7325 S is a home located in Box Elder County with nearby schools including Three Mile Creek School, Adele C. Young Intermediate School, and Box Elder Middle School.
Ownership History
Date
Name
Owned For
Owner Type
Purchase Details
Closed on
Jan 25, 2013
Sold by
Poll Carson and Poll Leni
Bought by
Poll Carson and Poll Leni
Current Estimated Value
Home Financials for this Owner
Home Financials are based on the most recent Mortgage that was taken out on this home.
Original Mortgage
$200,000
Outstanding Balance
$39,323
Interest Rate
3.33%
Mortgage Type
New Conventional
Estimated Equity
$551,426
Purchase Details
Closed on
Jun 10, 2010
Sold by
Seropian Steve G and Seropian Adrianna
Bought by
Poll Carson and Pontius Leni
Home Financials for this Owner
Home Financials are based on the most recent Mortgage that was taken out on this home.
Original Mortgage
$226,943
Interest Rate
4.75%
Mortgage Type
FHA
Purchase Details
Closed on
Feb 12, 2006
Sold by
Larson Clint J and Larson Monica A
Bought by
Seropian Steve G and Seropian Adrianna
Create a Home Valuation Report for This Property
The Home Valuation Report is an in-depth analysis detailing your home's value as well as a comparison with similar homes in the area
Home Values in the Area
Average Home Value in this Area
Purchase History
| Date | Buyer | Sale Price | Title Company |
|---|---|---|---|
| Poll Carson | -- | North American Title | |
| Poll Carson | -- | -- | |
| Seropian Steve G | -- | Intermountain Title & Escriw |
Source: Public Records
Mortgage History
| Date | Status | Borrower | Loan Amount |
|---|---|---|---|
| Open | Poll Carson | $200,000 | |
| Closed | Poll Carson | $226,943 |
Source: Public Records
Tax History Compared to Growth
Tax History
| Year | Tax Paid | Tax Assessment Tax Assessment Total Assessment is a certain percentage of the fair market value that is determined by local assessors to be the total taxable value of land and additions on the property. | Land | Improvement |
|---|---|---|---|---|
| 2025 | $2,695 | $526,377 | $180,000 | $346,377 |
| 2024 | $2,695 | $509,081 | $180,000 | $329,081 |
| 2023 | $2,679 | $527,377 | $180,000 | $347,377 |
| 2022 | $2,604 | $487,031 | $90,000 | $397,031 |
| 2021 | $2,159 | $308,394 | $90,000 | $218,394 |
| 2020 | $1,969 | $308,394 | $90,000 | $218,394 |
| 2019 | $1,726 | $139,517 | $34,100 | $105,417 |
| 2018 | $1,406 | $125,767 | $34,100 | $91,667 |
| 2017 | $1,723 | $228,667 | $34,100 | $166,667 |
| 2016 | $1,660 | $121,402 | $34,100 | $87,302 |
| 2015 | $1,275 | $113,465 | $34,100 | $79,365 |
| 2014 | $1,275 | $109,686 | $34,144 | $75,542 |
| 2013 | -- | $102,819 | $34,144 | $68,675 |
Source: Public Records
Map
Nearby Homes
- 581 W 7550 S
- 977 W 7300 S
- 7823 S 875 W
- 717 W 7950 S
- 860 W 8100 S
- 232 W 825 S
- 212 W 800 S Unit 340
- 241 W 825 S Unit 305
- Leighton Plan at Deer Run At Willard Bay - Deer Run
- Foxhill Plan at Deer Run At Willard Bay - Deer Run
- Norfolk Plan at Deer Run At Willard Bay - Deer Run
- Northfield Plan at Deer Run At Willard Bay - Deer Run
- Denford Plan at Deer Run At Willard Bay - Deer Run
- Clearpoint Plan at Deer Run At Willard Bay - Deer Run
- Cambria Plan at Deer Run At Willard Bay - Deer Run
- Berrington Plan at Deer Run At Willard Bay - Deer Run
- Ashland Plan at Deer Run At Willard Bay - Deer Run
- Whitman Plan at Deer Run At Willard Bay - Deer Run
- Ponderosa Plan at Deer Run At Willard Bay - Deer Run
- Twain Plan at Deer Run At Willard Bay - Deer Run