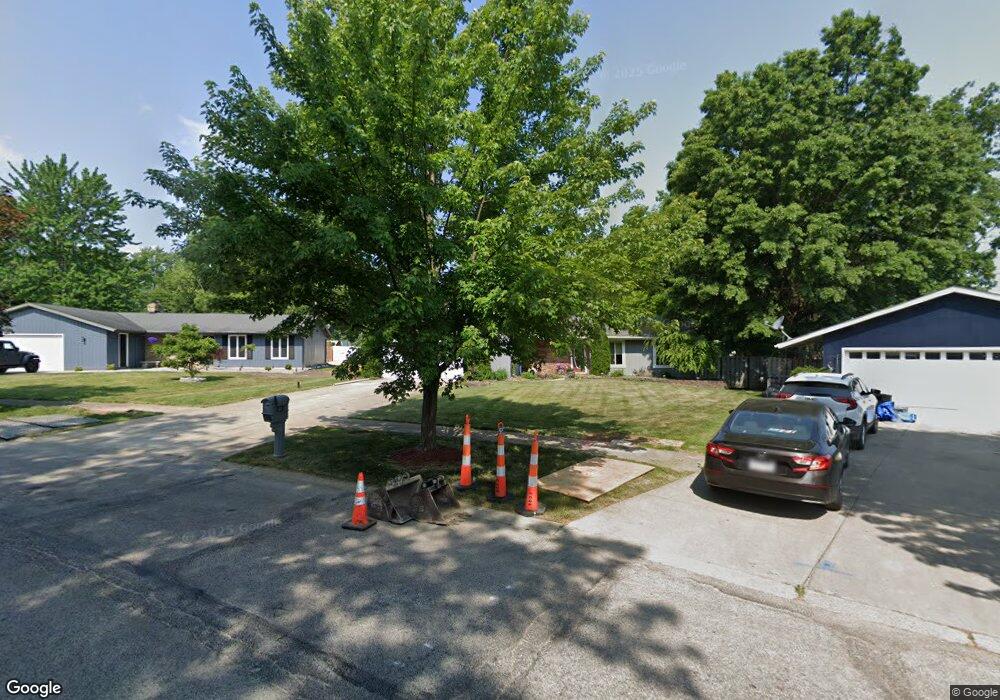
7660 Delaware Dr Middleburg Heights, OH 44130
Estimated Value: $318,062 - $358,000
4
Beds
2
Baths
2,026
Sq Ft
$168/Sq Ft
Est. Value
About This Home
This home is located at 7660 Delaware Dr, Middleburg Heights, OH 44130 and is currently estimated at $339,766, approximately $167 per square foot. 7660 Delaware Dr is a home located in Cuyahoga County with nearby schools including Big Creek Elementary School, Berea-Midpark Middle School, and Berea-Midpark High School.
Ownership History
Date
Name
Owned For
Owner Type
Purchase Details
Closed on
May 9, 2012
Sold by
Smith George A
Bought by
Smith Linda C
Current Estimated Value
Purchase Details
Closed on
Jul 7, 2000
Sold by
Figliano Tony P and Figliano Bonnie J
Bought by
Smith George A and Smith Linda C
Home Financials for this Owner
Home Financials are based on the most recent Mortgage that was taken out on this home.
Original Mortgage
$60,000
Outstanding Balance
$21,531
Interest Rate
8.27%
Estimated Equity
$318,235
Purchase Details
Closed on
Oct 12, 1988
Sold by
Vajda Ann
Bought by
Figliano Tony P
Purchase Details
Closed on
Sep 15, 1988
Sold by
Vajka Nicholas F
Bought by
Vajda Ann
Purchase Details
Closed on
Sep 24, 1984
Sold by
Klamert George R and Klamert Patricia
Bought by
Vajka Nicholas F
Purchase Details
Closed on
Jan 1, 1975
Bought by
Klamert George R and Klamert Patricia
Create a Home Valuation Report for This Property
The Home Valuation Report is an in-depth analysis detailing your home's value as well as a comparison with similar homes in the area
Home Values in the Area
Average Home Value in this Area
Purchase History
| Date | Buyer | Sale Price | Title Company |
|---|---|---|---|
| Smith Linda C | -- | Public | |
| Smith George A | $182,000 | -- | |
| Figliano Tony P | $120,000 | -- | |
| Vajda Ann | -- | -- | |
| Vajka Nicholas F | $95,000 | -- | |
| Klamert George R | -- | -- |
Source: Public Records
Mortgage History
| Date | Status | Borrower | Loan Amount |
|---|---|---|---|
| Open | Smith George A | $60,000 |
Source: Public Records
Tax History Compared to Growth
Tax History
| Year | Tax Paid | Tax Assessment Tax Assessment Total Assessment is a certain percentage of the fair market value that is determined by local assessors to be the total taxable value of land and additions on the property. | Land | Improvement |
|---|---|---|---|---|
| 2024 | $5,141 | $98,840 | $21,455 | $77,385 |
| 2023 | $4,520 | $71,650 | $16,310 | $55,340 |
| 2022 | $4,490 | $71,650 | $16,310 | $55,340 |
| 2021 | $4,464 | $71,650 | $16,310 | $55,340 |
| 2020 | $4,376 | $61,780 | $14,070 | $47,710 |
| 2019 | $4,250 | $176,500 | $40,200 | $136,300 |
| 2018 | $4,040 | $61,780 | $14,070 | $47,710 |
| 2017 | $4,154 | $55,970 | $13,300 | $42,670 |
| 2016 | $4,121 | $55,970 | $13,300 | $42,670 |
| 2015 | $3,769 | $55,970 | $13,300 | $42,670 |
| 2014 | $3,769 | $54,330 | $12,920 | $41,410 |
Source: Public Records
Map
Nearby Homes
- 7664 Gerald Dr
- 13541 Indian Creek Dr
- 14015 Byron Blvd
- 13976 W Sprague Rd
- 7685 Saratoga Rd
- 14280 Pawnee Trail
- 14330 Pawnee Trail
- 7596 W 130th St
- 7601 W 130th St
- 7432 Baldwin Creek Dr
- 12972 W Sprague Rd
- 8761 Windfall Ct
- 7547 N Linden Ln
- 8290 Crystal Creek Dr
- 7444 Briarcliff Pkwy
- 12939 W Pleasant Valley Rd
- 12631 Pinebrook Dr
- 7475 Lanier Dr
- 7330 Maplewood Rd
- 7470 Lanier Dr
- 13950 Delaware Dr
- 7668 Delaware Dr
- 7653 Trenton Trail
- 7661 Trenton Trail
- 7645 Trenton Trail
- 13926 Delaware Dr
- 7676 Delaware Dr
- 13999 Trenton Trail
- 13951 Trenton Trail
- 14041 Trenton Trail
- 7671 Delaware Dr
- 7677 Trenton Trail
- 13931 Trenton Trail
- 13900 Delaware Dr
- 7684 Delaware Dr
- 7679 Delaware Dr
- 13901 Trenton Trail
- 7685 Trenton Trail
- 13875 Delaware Dr
- 13872 Delaware Dr