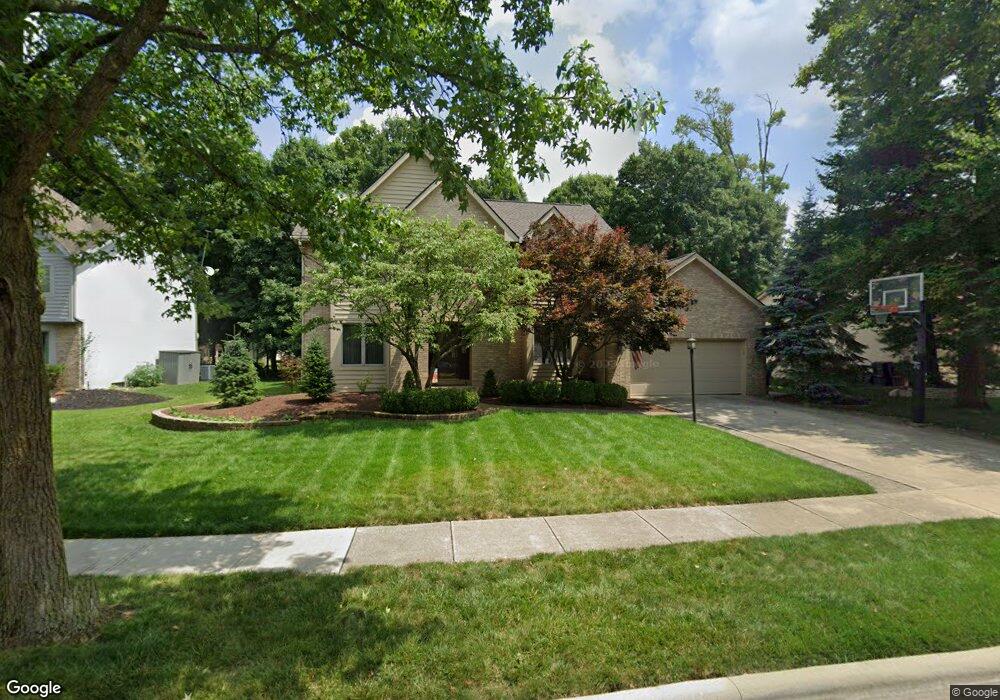
7664 Finbarr Ct Dublin, OH 43017
Estimated Value: $573,861 - $633,000
4
Beds
3
Baths
2,476
Sq Ft
$240/Sq Ft
Est. Value
About This Home
This home is located at 7664 Finbarr Ct, Dublin, OH 43017 and is currently estimated at $595,215, approximately $240 per square foot. 7664 Finbarr Ct is a home located in Franklin County with nearby schools including Wyandot Elementary School, Henry Karrer Middle School, and Dublin Coffman High School.
Ownership History
Date
Name
Owned For
Owner Type
Purchase Details
Closed on
Apr 11, 2018
Sold by
Shelley Michael P and Shelley Diane J
Bought by
Shelley Michael P and Shelley Diane J
Current Estimated Value
Purchase Details
Closed on
Jul 8, 2005
Sold by
Connel John D and Connel Christine W
Bought by
Shelley Michael P and Shelley Diane J
Purchase Details
Closed on
Nov 12, 2002
Sold by
Beith Thomas M and Beith Monica A
Bought by
Connel John D and Connel Christine W
Purchase Details
Closed on
Aug 14, 1996
Sold by
Walters Steven J
Bought by
Beith Thomas M and Beith Monica A
Home Financials for this Owner
Home Financials are based on the most recent Mortgage that was taken out on this home.
Original Mortgage
$200,000
Outstanding Balance
$9,441
Interest Rate
7.38%
Mortgage Type
New Conventional
Estimated Equity
$585,774
Purchase Details
Closed on
Mar 19, 1993
Purchase Details
Closed on
Oct 23, 1992
Create a Home Valuation Report for This Property
The Home Valuation Report is an in-depth analysis detailing your home's value as well as a comparison with similar homes in the area
Home Values in the Area
Average Home Value in this Area
Purchase History
| Date | Buyer | Sale Price | Title Company |
|---|---|---|---|
| Shelley Michael P | -- | None Available | |
| Shelley Michael P | $312,000 | Chicago Tit | |
| Connel John D | $287,000 | -- | |
| Beith Thomas M | $225,500 | -- | |
| -- | $213,800 | -- | |
| -- | $134,000 | -- |
Source: Public Records
Mortgage History
| Date | Status | Borrower | Loan Amount |
|---|---|---|---|
| Open | Beith Thomas M | $200,000 |
Source: Public Records
Tax History
| Year | Tax Paid | Tax Assessment Tax Assessment Total Assessment is a certain percentage of the fair market value that is determined by local assessors to be the total taxable value of land and additions on the property. | Land | Improvement |
|---|---|---|---|---|
| 2025 | $11,536 | $177,560 | $49,000 | $128,560 |
| 2024 | $11,536 | $177,560 | $49,000 | $128,560 |
| 2023 | $11,376 | $177,560 | $49,000 | $128,560 |
| 2022 | $8,852 | $126,290 | $31,330 | $94,960 |
| 2021 | $8,873 | $126,290 | $31,330 | $94,960 |
| 2020 | $8,947 | $126,290 | $31,330 | $94,960 |
| 2019 | $8,326 | $103,950 | $26,110 | $77,840 |
| 2018 | $8,502 | $103,950 | $26,110 | $77,840 |
| 2017 | $7,749 | $103,950 | $26,110 | $77,840 |
| 2016 | $8,587 | $108,160 | $22,090 | $86,070 |
| 2015 | $8,643 | $108,160 | $22,090 | $86,070 |
| 2014 | $8,653 | $108,160 | $22,090 | $86,070 |
| 2013 | $4,193 | $103,005 | $21,035 | $81,970 |
Source: Public Records
Map
Nearby Homes
- 5987 Dunabbey Loop
- 7886 Nassau Loop
- 7645 Fulmar Dr
- 7246 Sundown Ct
- 5877 Tarton Cir S
- 7199 Achill Dr
- 7195 Dominick Ct
- 7081 Wendy Trail Ln
- 5578 Corey Swirl Dr
- 6341 Tara Hill Dr
- 6258 Wexford Woods Dr
- 6031 Cromdale Dr
- 9786 Mesquite Ct
- 7027 Dublin Village Dr
- 7171 Blessington Ct
- 6498 Wyndburne Dr
- 7785 Kate Brown Dr
- 6050 Kentigern Ct S
- 7440 Wellington Reserve Ct
- 5317 Adventure Dr
- 7676 Finbarr Ct
- 7652 Finbarr Ct
- 7653 Cashel Ct
- 7665 Cashel Ct
- 7686 Finbarr Ct
- 7667 Finbarr Ct
- 7657 Finbarr Ct
- 7675 Cashel Ct
- 7679 Finbarr Ct
- 7641 Finbarr Ct
- 7687 Cashel Ct
- 7694 Finbarr Ct
- 7691 Finbarr Ct
- 7728 Richens Dr
- 7720 Richens Dr
- 7652 Cashel Ct
- 7736 Richens Dr
- 7699 Cashel Ct
- 7712 Richens Dr
- 7664 Cashel Ct
Your Personal Tour Guide
Ask me questions while you tour the home.