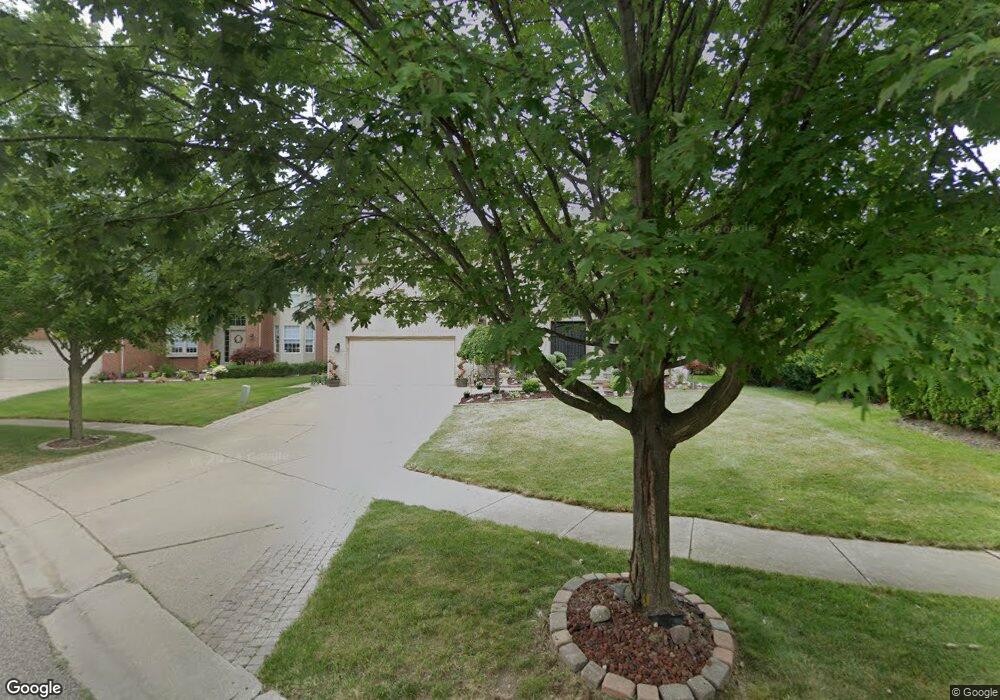
7664 Windgate Cir Unit 31 West Bloomfield, MI 48323
West Bloomfield Township NeighborhoodEstimated Value: $660,973 - $782,000
4
Beds
4
Baths
2,927
Sq Ft
$243/Sq Ft
Est. Value
About This Home
This home is located at 7664 Windgate Cir Unit 31, West Bloomfield, MI 48323 and is currently estimated at $710,243, approximately $242 per square foot. 7664 Windgate Cir Unit 31 is a home located in Oakland County with nearby schools including Walled Lake Central High School, St. Matthew Lutheran School, and St. William School.
Ownership History
Date
Name
Owned For
Owner Type
Purchase Details
Closed on
Sep 24, 2021
Sold by
Sesi Afnan and Sesi Maysa
Bought by
Semma Raad and Semma Terri
Current Estimated Value
Home Financials for this Owner
Home Financials are based on the most recent Mortgage that was taken out on this home.
Original Mortgage
$235,000
Outstanding Balance
$212,898
Interest Rate
2.8%
Mortgage Type
Purchase Money Mortgage
Estimated Equity
$497,345
Purchase Details
Closed on
Dec 23, 2008
Sold by
Semma Terri G
Bought by
Sesi Afnan and Sesi Maysa
Home Financials for this Owner
Home Financials are based on the most recent Mortgage that was taken out on this home.
Original Mortgage
$251,100
Interest Rate
5.53%
Mortgage Type
Purchase Money Mortgage
Purchase Details
Closed on
Nov 28, 2001
Sold by
Pulte Land Co
Bought by
Semma Terri G
Home Financials for this Owner
Home Financials are based on the most recent Mortgage that was taken out on this home.
Original Mortgage
$274,646
Interest Rate
6.53%
Create a Home Valuation Report for This Property
The Home Valuation Report is an in-depth analysis detailing your home's value as well as a comparison with similar homes in the area
Home Values in the Area
Average Home Value in this Area
Purchase History
We collect this data history from publicly available records. To have your information removed, we recommend requesting removal directly through your county’s website.
| Date | Buyer | Sale Price | Title Company |
|---|---|---|---|
| Semma Raad | $213,000 | None Available | |
| Sesi Afnan | $279,100 | None Available | |
| Semma Terri G | $129,000 | -- |
Source: Public Records
Mortgage History
We collect this data history from publicly available records. To have your information removed, we recommend requesting removal directly through your county’s website.
| Date | Status | Borrower | Loan Amount |
|---|---|---|---|
| Open | Semma Raad | $235,000 | |
| Previous Owner | Sesi Afnan | $251,100 | |
| Previous Owner | Semma Terri G | $274,646 |
Source: Public Records
Tax History
| Year | Tax Paid | Tax Assessment Tax Assessment Total Assessment is a certain percentage of the fair market value that is determined by local assessors to be the total taxable value of land and additions on the property. | Land | Improvement |
|---|---|---|---|---|
| 2025 | $8,806 | $303,800 | $16,630 | $287,170 |
| 2024 | $4,950 | $283,460 | $0 | $0 |
| 2022 | $4,667 | $230,870 | $16,630 | $214,240 |
| 2021 | $7,751 | $225,170 | $0 | $0 |
| 2020 | $6,433 | $214,390 | $16,630 | $197,760 |
| 2018 | $8,637 | $198,350 | $17,500 | $180,850 |
| 2015 | -- | $190,270 | $0 | $0 |
| 2014 | -- | $172,900 | $0 | $0 |
| 2011 | -- | $152,010 | $0 | $0 |
Source: Public Records
Map
Nearby Homes
- 7555 Windgate Cir
- 7585 Pontiac Trail
- 7590 Acorn Hill Ct
- 7545 Pontiac Trail
- 7842 Trailside Ct
- 7829 Trailside Ct
- 7832 Trailside Ct
- 7841 Trailside Ct
- 5506 Helmsdale Blvd
- 5526 Helmsdale Blvd
- 2942 Montgomery Cir
- 5545 Helmsdale Blvd
- 7230 Walnut Lake Rd
- 5146 Lagoons Cir Unit 22
- 1047 Addison Cir
- 7636 Larchwood Dr
- 5620 Suffolk Ct
- 7635 Larchwood Dr
- 0000 Kress Rd
- 7639 Larchwood Dr
- 7660 Windgate Cir
- 7668 Windgate Cir
- 7658 Windgate Cir
- 7670 Windgate Cir
- 7672 Windgate Cir Unit 28
- 7673 Windgate Cir
- 7659 Windgate Cir
- 7674 Windgate Cir Unit 27
- 7657 Windgate Cir Unit 34
- 7675 Windgate Cir Unit 37
- 7559 Windgate Cir
- 7676 Windgate Cir Unit 26
- 4980 Lake Crest Dr Unit 3
- 7563 Windgate Cir
- 7560 Windgate Cir
- 7685 Windgate Cir
- 7791 Pontiac Trail
- 7680 Windgate Cir
- 4968 Lake Crest Dr Unit 2
- 7566 Windgate Cir Unit 44
Your Personal Tour Guide
Ask me questions while you tour the home.