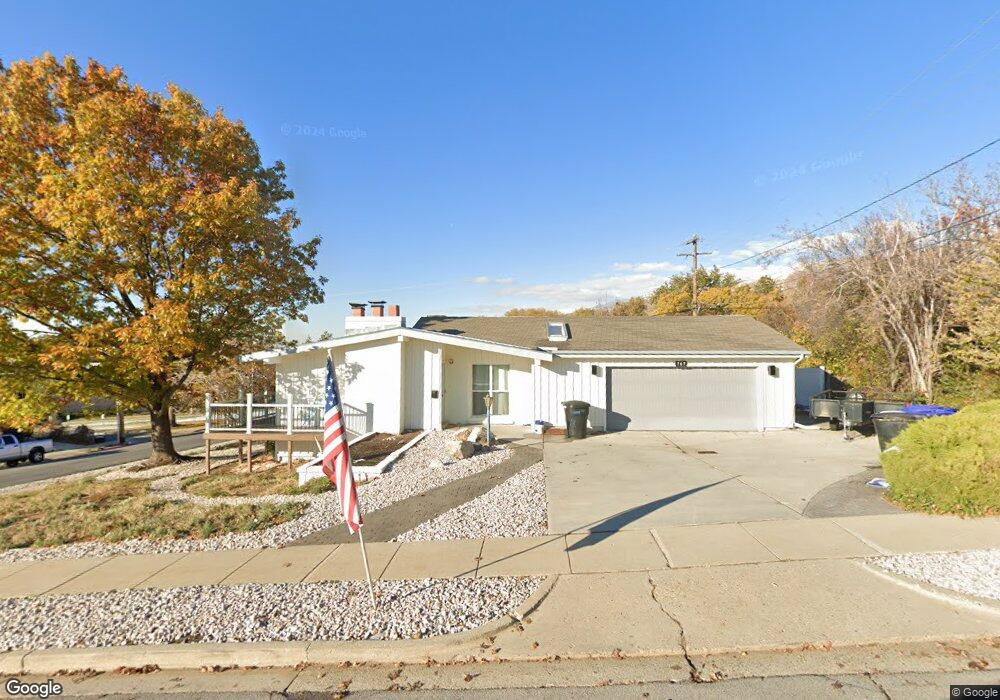
767 E 700 S Bountiful, UT 84010
Estimated Value: $531,000 - $648,000
5
Beds
3
Baths
2,696
Sq Ft
$215/Sq Ft
Est. Value
About This Home
This home is located at 767 E 700 S, Bountiful, UT 84010 and is currently estimated at $580,596, approximately $215 per square foot. 767 E 700 S is a home located in Davis County with nearby schools including Oak Hills School, Millcreek Junior High School, and Bountiful High School.
Ownership History
Date
Name
Owned For
Owner Type
Purchase Details
Closed on
Feb 9, 2026
Sold by
Allen Roy V
Bought by
Allen Roy V and Allen Judith G
Current Estimated Value
Purchase Details
Closed on
Aug 21, 2020
Sold by
Pehrson Real Estate Pc
Bought by
Allen Roy V
Home Financials for this Owner
Home Financials are based on the most recent Mortgage that was taken out on this home.
Original Mortgage
$350,040
Interest Rate
3%
Mortgage Type
Commercial
Purchase Details
Closed on
Jun 26, 2020
Sold by
Jeong Changhoon and Jeong Eunyoung Back
Bought by
Pehrson Real Estate Pc
Home Financials for this Owner
Home Financials are based on the most recent Mortgage that was taken out on this home.
Original Mortgage
$350,040
Interest Rate
3%
Mortgage Type
Commercial
Purchase Details
Closed on
Aug 14, 2003
Sold by
Mercer Terry S and Brook Mercer E
Bought by
Jeong Changhoon and Jeong Eunyoung Back
Home Financials for this Owner
Home Financials are based on the most recent Mortgage that was taken out on this home.
Original Mortgage
$173,514
Interest Rate
5.46%
Mortgage Type
FHA
Create a Home Valuation Report for This Property
The Home Valuation Report is an in-depth analysis detailing your home's value as well as a comparison with similar homes in the area
Purchase History
| Date | Buyer | Sale Price | Title Company |
|---|---|---|---|
| Allen Roy V | -- | Steed Title | |
| Allen Roy V | -- | Accommodation | |
| Pehrson Real Estate Pc | -- | Steed Title Insurance | |
| Jeong Changhoon | -- | -- |
Source: Public Records
Mortgage History
| Date | Status | Borrower | Loan Amount |
|---|---|---|---|
| Previous Owner | Allen Roy V | $350,040 | |
| Previous Owner | Pehrson Real Estate Pc | $350,000 | |
| Previous Owner | Jeong Changhoon | $173,514 |
Source: Public Records
Tax History
| Year | Tax Paid | Tax Assessment Tax Assessment Total Assessment is a certain percentage of the fair market value that is determined by local assessors to be the total taxable value of land and additions on the property. | Land | Improvement |
|---|---|---|---|---|
| 2025 | $3,361 | $285,450 | $135,830 | $149,620 |
| 2024 | $2,961 | $276,099 | $124,538 | $151,561 |
| 2023 | $2,831 | $263,450 | $124,400 | $139,049 |
| 2022 | $3,007 | $509,000 | $223,134 | $285,866 |
| 2021 | $2,729 | $389,000 | $160,737 | $228,263 |
| 2020 | $2,429 | $347,000 | $136,132 | $210,868 |
| 2019 | $2,463 | $344,000 | $136,040 | $207,960 |
| 2018 | $2,302 | $316,000 | $133,181 | $182,819 |
| 2016 | $1,853 | $136,895 | $56,031 | $80,864 |
| 2015 | $1,818 | $126,720 | $56,031 | $70,689 |
| 2014 | $1,726 | $123,582 | $56,031 | $67,551 |
| 2013 | -- | $93,548 | $55,332 | $38,216 |
Source: Public Records
Map
Nearby Homes
- 456 E 500 S
- 861 E Millbrook Way
- 698 E 200 S
- 323 Peach Ln
- 275 E Peach Ln S
- 795 Abby Ln Unit 5
- 775 E 1500 S
- 6 N 800 E
- 255 E 400 S
- 683 E 100 N
- 129 N 800 E
- 380 E 1500 S
- 545 S 100 E
- 357 S 100 E
- 631 E 1700 S
- 1761 S Davis Blvd
- 1812 S 900 E
- 650 S Main St Unit 7107
- 650 S Main St Unit 6206
- 650 S Main St Unit 4104
Your Personal Tour Guide
Ask me questions while you tour the home.