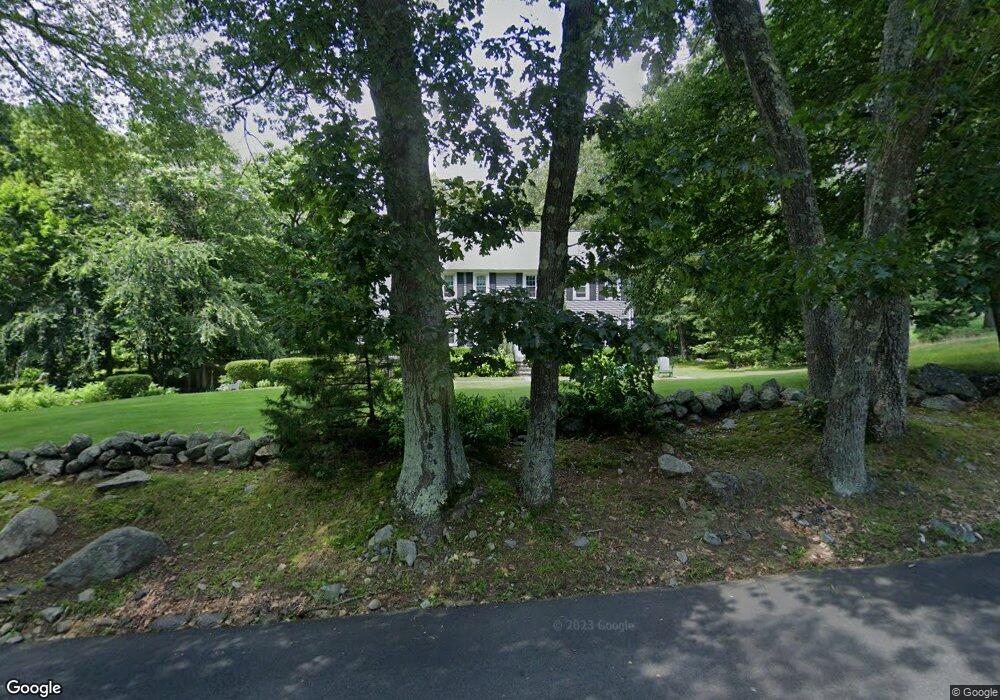
767 Elm St Marlborough, MA 01752
Estimated Value: $741,000 - $900,000
4
Beds
3
Baths
2,386
Sq Ft
$333/Sq Ft
Est. Value
About This Home
This home is located at 767 Elm St, Marlborough, MA 01752 and is currently estimated at $794,545, approximately $333 per square foot. 767 Elm St is a home located in Middlesex County with nearby schools including Marlborough High School, Advanced Math & Science Academy, and St. Bernadette School.
Ownership History
Date
Name
Owned For
Owner Type
Purchase Details
Closed on
Apr 11, 2002
Sold by
Jones Robert C
Bought by
Garvey Michael F and Garvey Margaret S
Current Estimated Value
Home Financials for this Owner
Home Financials are based on the most recent Mortgage that was taken out on this home.
Original Mortgage
$215,000
Interest Rate
6.84%
Mortgage Type
Purchase Money Mortgage
Purchase Details
Closed on
Aug 15, 1990
Sold by
Norton David R
Bought by
Jones Robert C
Create a Home Valuation Report for This Property
The Home Valuation Report is an in-depth analysis detailing your home's value as well as a comparison with similar homes in the area
Home Values in the Area
Average Home Value in this Area
Purchase History
| Date | Buyer | Sale Price | Title Company |
|---|---|---|---|
| Garvey Michael F | $390,000 | -- | |
| Jones Robert C | $233,500 | -- |
Source: Public Records
Mortgage History
| Date | Status | Borrower | Loan Amount |
|---|---|---|---|
| Open | Jones Robert C | $164,000 | |
| Closed | Garvey Michael F | $215,000 | |
| Previous Owner | Jones Robert C | $150,000 | |
| Previous Owner | Jones Robert C | $30,000 |
Source: Public Records
Tax History Compared to Growth
Tax History
| Year | Tax Paid | Tax Assessment Tax Assessment Total Assessment is a certain percentage of the fair market value that is determined by local assessors to be the total taxable value of land and additions on the property. | Land | Improvement |
|---|---|---|---|---|
| 2025 | $6,575 | $666,800 | $232,000 | $434,800 |
| 2024 | $6,350 | $620,100 | $211,300 | $408,800 |
| 2023 | $6,742 | $584,200 | $174,200 | $410,000 |
| 2022 | $6,532 | $497,900 | $166,300 | $331,600 |
| 2021 | $6,336 | $459,100 | $136,700 | $322,400 |
| 2020 | $6,266 | $441,900 | $133,400 | $308,500 |
| 2019 | $6,056 | $430,400 | $131,100 | $299,300 |
| 2018 | $6,069 | $414,800 | $121,300 | $293,500 |
| 2017 | $6,007 | $392,100 | $123,200 | $268,900 |
| 2016 | $5,840 | $380,700 | $123,200 | $257,500 |
| 2015 | $5,930 | $376,300 | $127,000 | $249,300 |
Source: Public Records
Map
Nearby Homes
- 0 Dudley St
- 28 Evelina Dr
- 10 Masciarelli Dr
- 207 Bigelow St
- 55 Hurley Cir
- 72 Foley Rd
- 306 Berlin Rd
- 490 Main St Unit 101
- 238 W Hill Rd
- 287 Elm St
- 280 Elm St Unit A6
- 120 Airport Blvd
- 30A Winter Ave
- 76 Broad St
- 156 Chestnut St
- 8 Saint Mary's Way Unit 8
- 118 Elm St
- 425 Pleasant St
- 30 Broad St Unit 104
- 0 Pleasant St