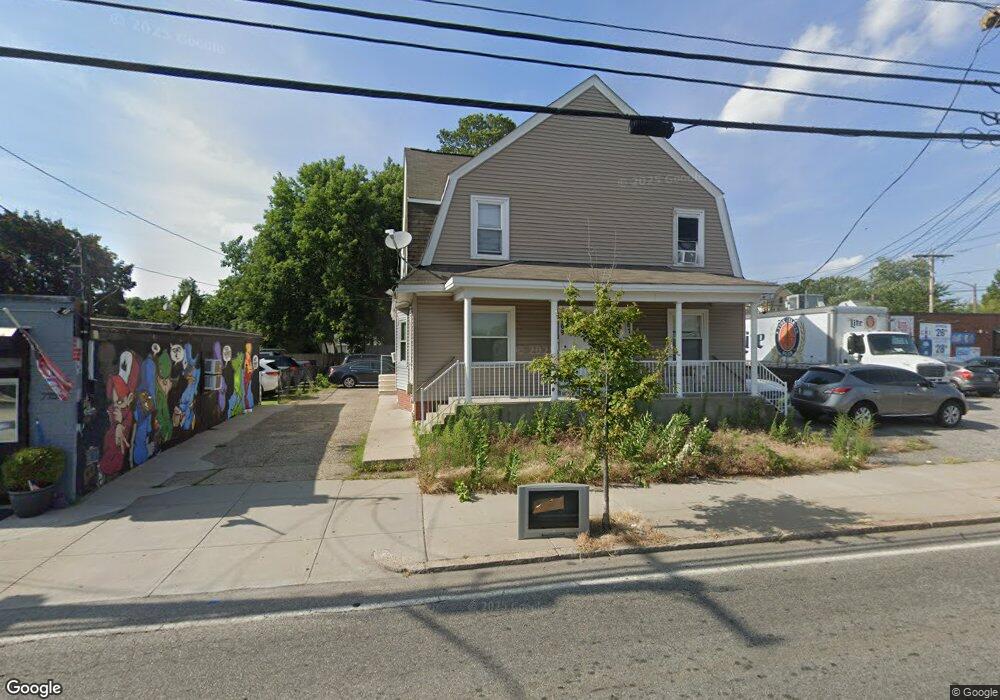
767 Mineral Spring Ave Pawtucket, RI 02860
Fairlawn NeighborhoodEstimated Value: $468,829 - $601,000
6
Beds
2
Baths
2,696
Sq Ft
$207/Sq Ft
Est. Value
About This Home
This home is located at 767 Mineral Spring Ave, Pawtucket, RI 02860 and is currently estimated at $557,457, approximately $206 per square foot. 767 Mineral Spring Ave is a home located in Providence County with nearby schools including Blackstone Valley Prep Upper Elementary School, Blackstone Valley Prep Junior High School, and Bishop Keough Regional High School.
Ownership History
Date
Name
Owned For
Owner Type
Purchase Details
Closed on
Jan 20, 2010
Sold by
Vartanian Corri E
Bought by
Vartanian Gregory
Current Estimated Value
Purchase Details
Closed on
Dec 16, 1999
Sold by
Ricci Ernest
Bought by
Vartanian Gregory and Vartanian Corri E
Home Financials for this Owner
Home Financials are based on the most recent Mortgage that was taken out on this home.
Original Mortgage
$85,000
Interest Rate
7.81%
Purchase Details
Closed on
Jul 26, 1993
Sold by
Sugerman Beverly G
Bought by
Fortes Joao R and Fortes Paulo J
Home Financials for this Owner
Home Financials are based on the most recent Mortgage that was taken out on this home.
Original Mortgage
$99,700
Interest Rate
7.43%
Create a Home Valuation Report for This Property
The Home Valuation Report is an in-depth analysis detailing your home's value as well as a comparison with similar homes in the area
Home Values in the Area
Average Home Value in this Area
Purchase History
| Date | Buyer | Sale Price | Title Company |
|---|---|---|---|
| Vartanian Gregory | -- | -- | |
| Vartanian Gregory | $110,000 | -- | |
| Fortes Joao R | $150,000 | -- |
Source: Public Records
Mortgage History
| Date | Status | Borrower | Loan Amount |
|---|---|---|---|
| Previous Owner | Fortes Joao R | $68,000 | |
| Previous Owner | Fortes Joao R | $85,000 | |
| Previous Owner | Fortes Joao R | $99,700 |
Source: Public Records
Tax History Compared to Growth
Tax History
| Year | Tax Paid | Tax Assessment Tax Assessment Total Assessment is a certain percentage of the fair market value that is determined by local assessors to be the total taxable value of land and additions on the property. | Land | Improvement |
|---|---|---|---|---|
| 2025 | $5,406 | $411,100 | $109,100 | $302,000 |
| 2024 | $5,073 | $411,100 | $109,100 | $302,000 |
| 2023 | $4,071 | $240,300 | $82,700 | $157,600 |
| 2022 | $3,984 | $240,300 | $82,700 | $157,600 |
| 2021 | $3,984 | $240,300 | $82,700 | $157,600 |
| 2020 | $3,808 | $182,300 | $64,600 | $117,700 |
| 2019 | $3,808 | $182,300 | $64,600 | $117,700 |
| 2018 | $3,670 | $182,300 | $64,600 | $117,700 |
| 2017 | $3,683 | $162,100 | $56,300 | $105,800 |
| 2016 | $3,548 | $162,100 | $56,300 | $105,800 |
| 2015 | $3,548 | $162,100 | $56,300 | $105,800 |
| 2014 | $3,584 | $155,400 | $56,300 | $99,100 |
Source: Public Records
Map
Nearby Homes
- 424 Smithfield Ave Unit 1
- 422 Smithfield Ave Unit 1
- 12 Legion Dr
- 168 W Forest Ave
- 56 Legion Dr
- 132 Hobson Ave
- 21 Urban Ave
- 27 Stedman Ave
- 149 Oakdale Ave
- 123 Francis Ave
- 82 Hillcrest Ave
- 20 Dickinson Ave
- 12 Atwood Ave
- 199 Morris Ave
- 221 Columbia Ave
- 192 Terrace Ave
- 136 Samuel Ave
- 10 Windmill St
- 584 Weeden St
- 16 Rufus St
- 767 Mineral Spring Ave Unit 2
- 767 Mineral Spring Ave Unit 1
- 775 Mineral Spring Ave
- 771 Mineral Spring Ave
- 781 Mineral Spring Ave
- 30 Prentice Ave
- 14 Prentice Ave
- 793 Mineral Spring Ave
- 36 Prentice Ave
- 0 Smithfield Ave
- 44 Prentice Ave
- 792 Mineral Spring Ave
- 797 Mineral Spring Ave
- 794 Mineral Spring Ave
- 50 Prentice Ave
- 807 Mineral Spring Ave
- 796 Mineral Spring Ave
- 753 Mineral Spring Ave
- 31 Prentice Ave
- 13 Prentice Ave