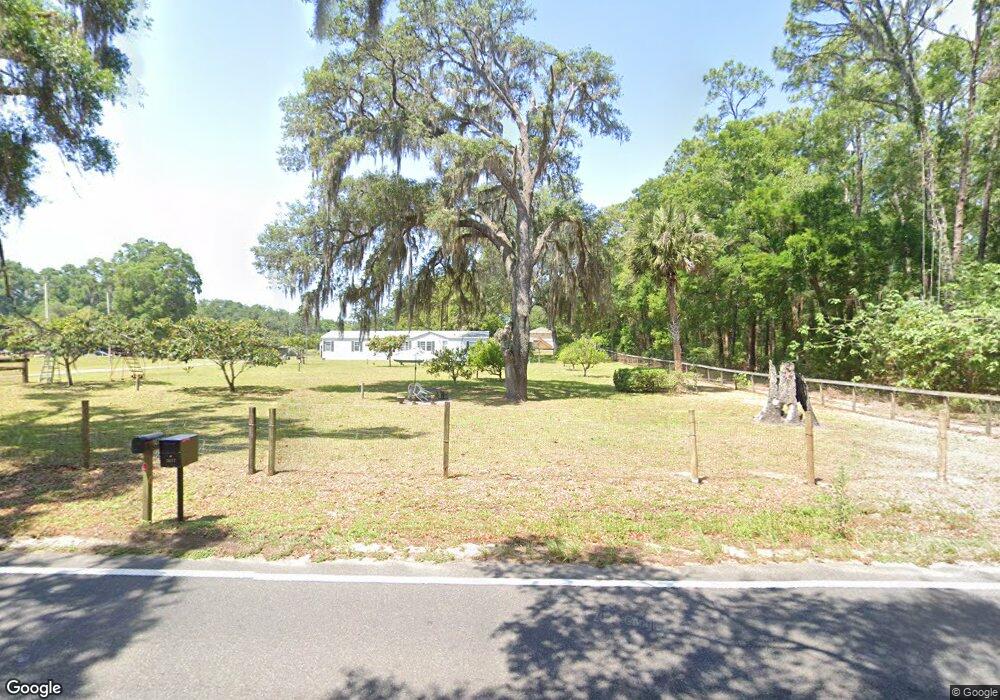
7670 SE 41st Ct Ocala, FL 34480
Silver Spring Shores NeighborhoodEstimated Value: $205,805 - $321,000
4
Beds
3
Baths
1,816
Sq Ft
$132/Sq Ft
Est. Value
About This Home
This home is located at 7670 SE 41st Ct, Ocala, FL 34480 and is currently estimated at $239,701, approximately $131 per square foot. 7670 SE 41st Ct is a home located in Marion County with nearby schools including Shady Hill Elementary School, Belleview Middle School, and Belleview High School.
Ownership History
Date
Name
Owned For
Owner Type
Purchase Details
Closed on
Oct 19, 2023
Sold by
Rivera Jose D
Bought by
Valba Group Llc
Current Estimated Value
Home Financials for this Owner
Home Financials are based on the most recent Mortgage that was taken out on this home.
Original Mortgage
$145,000
Outstanding Balance
$88,420
Interest Rate
7.12%
Mortgage Type
New Conventional
Estimated Equity
$151,281
Purchase Details
Closed on
Apr 7, 2010
Sold by
Rivera Jose M
Bought by
Rivera Jose D
Purchase Details
Closed on
Jan 16, 2007
Sold by
Rivera Jose and Rivera Jose M
Bought by
Rivera Jose M and Rivera Jose D
Create a Home Valuation Report for This Property
The Home Valuation Report is an in-depth analysis detailing your home's value as well as a comparison with similar homes in the area
Home Values in the Area
Average Home Value in this Area
Purchase History
| Date | Buyer | Sale Price | Title Company |
|---|---|---|---|
| Valba Group Llc | $175,000 | First American Title Insurance | |
| Rivera Jose D | -- | None Available | |
| Rivera Jose M | -- | Affiliated Title Of Marion C |
Source: Public Records
Mortgage History
| Date | Status | Borrower | Loan Amount |
|---|---|---|---|
| Open | Valba Group Llc | $145,000 |
Source: Public Records
Tax History
| Year | Tax Paid | Tax Assessment Tax Assessment Total Assessment is a certain percentage of the fair market value that is determined by local assessors to be the total taxable value of land and additions on the property. | Land | Improvement |
|---|---|---|---|---|
| 2025 | $4,236 | $209,999 | $39,950 | $170,049 |
| 2024 | $4,243 | $233,906 | $25,568 | $208,338 |
| 2023 | $4,243 | $142,632 | -- | -- |
| 2022 | $3,063 | $129,665 | $0 | $0 |
| 2021 | $2,519 | $117,877 | $13,583 | $104,294 |
| 2020 | $2,447 | $112,610 | $11,186 | $101,424 |
| 2019 | $2,448 | $111,479 | $11,186 | $100,293 |
| 2018 | $2,310 | $107,941 | $11,186 | $96,755 |
| 2017 | $1,476 | $94,085 | $0 | $0 |
| 2016 | $1,420 | $92,150 | $0 | $0 |
| 2015 | $1,415 | $91,509 | $0 | $0 |
| 2014 | $1,346 | $90,783 | $0 | $0 |
Source: Public Records
Map
Nearby Homes
- 156 Juniper Cir
- 0 Tbd Se 75th St
- TBD Juniper Loop Place
- 228 Juniper Loop Cir
- 23 Juniper Loop Ct
- 112 Larch Rd
- 41 Juniper Loop Ct
- 24 Juniper Dr
- 46 Juniper Dr
- 31 Juniper Dr
- 3 7850 S Us Hywy 441 Unit 3
- 176 Juniper Loop Cir
- 0 U S 301
- 146 Juniper Loop Cir
- 241 Chestnut Rd
- 0 Juniper Rd Unit MFRS5136963
- 0 Juniper Loop Cir Unit MFROM692865
- 3980 SE 84th Lane Rd
- 137 Juniper Loop
- 54 Juniper Trail Loop
- 7800 SE 41st Ct
- 7770 SE 41st Ct
- 7900 SE 41st Ct
- 7885 SE 41st Ct
- 3931 SE 80th St
- 3931 SE 80th St
- 3985 SE 80th St
- 3995 SE 80th St
- 4041 SE 80th St
- 7639 SE 36th Ave
- 4001 SE 80th St
- 3861 SE 80th St
- 4206 SE 79th St
- 4242 SE 79th St
- 3841 SE 80th St
- 7617 SE 36th Ave
- 3990 SE 80th St
- 4259 SE 79th St
- 3920 SE 80th St
- 3740 SE 73rd St
Your Personal Tour Guide
Ask me questions while you tour the home.