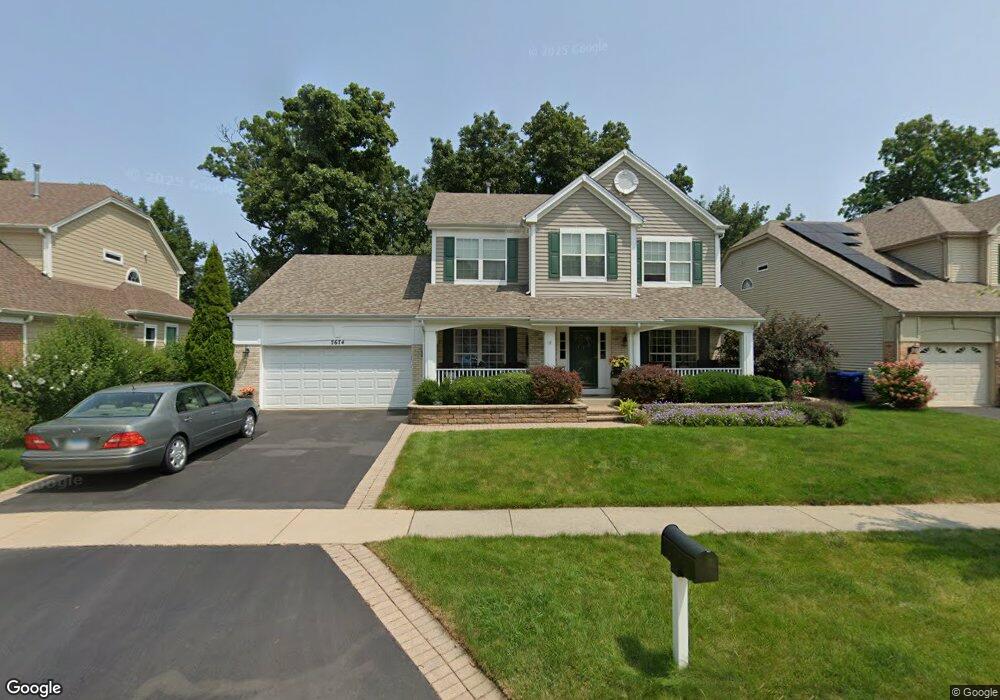
7674 Cascade Way Gurnee, IL 60031
Estimated Value: $532,000 - $608,000
4
Beds
3
Baths
2,759
Sq Ft
$204/Sq Ft
Est. Value
About This Home
This home is located at 7674 Cascade Way, Gurnee, IL 60031 and is currently estimated at $562,734, approximately $203 per square foot. 7674 Cascade Way is a home located in Lake County with nearby schools including Woodland Primary School, Woodland Elementary School, and Woodland Intermediate School.
Ownership History
Date
Name
Owned For
Owner Type
Purchase Details
Closed on
Mar 23, 2018
Sold by
Ziebro Christopher R and Ziebro Joy A
Bought by
Ziebro Christopher R and Christopher R Ziber Trust
Current Estimated Value
Purchase Details
Closed on
Oct 14, 1999
Sold by
Tinsley Michael E and Tinsley Laura L
Bought by
Ziebro Christopher R
Home Financials for this Owner
Home Financials are based on the most recent Mortgage that was taken out on this home.
Original Mortgage
$263,700
Interest Rate
7.97%
Purchase Details
Closed on
Nov 3, 1998
Sold by
Sundance Suburban Properties Inc
Bought by
Tinsley Michael E and Tinsley Laura L
Home Financials for this Owner
Home Financials are based on the most recent Mortgage that was taken out on this home.
Original Mortgage
$217,600
Interest Rate
6.59%
Create a Home Valuation Report for This Property
The Home Valuation Report is an in-depth analysis detailing your home's value as well as a comparison with similar homes in the area
Home Values in the Area
Average Home Value in this Area
Purchase History
| Date | Buyer | Sale Price | Title Company |
|---|---|---|---|
| Ziebro Christopher R | -- | Heritage Title Company | |
| Ziebro Christopher R | $293,000 | First American Title | |
| Tinsley Michael E | $273,000 | Ticor Title |
Source: Public Records
Mortgage History
| Date | Status | Borrower | Loan Amount |
|---|---|---|---|
| Previous Owner | Ziebro Christopher R | $263,700 | |
| Previous Owner | Tinsley Michael E | $217,600 |
Source: Public Records
Tax History
| Year | Tax Paid | Tax Assessment Tax Assessment Total Assessment is a certain percentage of the fair market value that is determined by local assessors to be the total taxable value of land and additions on the property. | Land | Improvement |
|---|---|---|---|---|
| 2024 | $12,922 | $150,252 | $23,992 | $126,260 |
| 2023 | $11,682 | $139,497 | $22,275 | $117,222 |
| 2022 | $11,682 | $125,845 | $22,283 | $103,562 |
| 2021 | $10,561 | $120,796 | $21,389 | $99,407 |
| 2020 | $10,221 | $117,827 | $20,863 | $96,964 |
| 2019 | $9,931 | $114,406 | $20,257 | $94,149 |
| 2018 | $9,541 | $111,463 | $21,301 | $90,162 |
| 2017 | $9,440 | $108,269 | $20,691 | $87,578 |
| 2016 | $9,367 | $103,449 | $19,770 | $83,679 |
| 2015 | $9,125 | $98,112 | $18,750 | $79,362 |
| 2014 | $8,661 | $94,054 | $18,482 | $75,572 |
| 2012 | $8,207 | $94,775 | $18,624 | $76,151 |
Source: Public Records
Map
Nearby Homes
- 7817 Cascade Way
- 528 Cliffwood Ln
- 767 Aster Dr
- 1107 Vineyard Dr
- 1094 Vista Dr
- 415 Kingsport Dr
- 1158 Vista Dr
- 7390 Bittersweet Dr
- 7449 Brentwood Ln
- 968 Knowles Rd
- 7421 Prescott Ln
- 7663 Gamay Ct
- 18184 W Old Pine Ct
- 18224 W Old Pine Ct
- 18500 W Aspen Ct
- 1195 Hadley Cir
- 575 Capital Ln
- 498 Capital Ln
- 34271 N Tangueray Dr
- 1605 Samuel Ct
- 7668 Cascade Way
- 7680 Cascade Way Unit 3
- 7660 Cascade Way
- 7686 Cascade Way
- 740 Snow Cap Ct
- 7689 Cascade Way Unit 3
- 7654 Cascade Way
- 7702 Cascade Way
- 7703 Cascade Way
- 736 Snow Cap Ct
- 7713 Cascade Way
- 7646 Cascade Way Unit 3
- 7712 Cascade Way
- 7719 Cascade Way
- 730 Snow Cap Ct Unit 3
- 671 Snow Cap Ct
- 7640 Cascade Way
- 724 Snow Cap Ct
- 677 Snow Cap Ct
- 7722 Cascade Way Unit 3
Your Personal Tour Guide
Ask me questions while you tour the home.