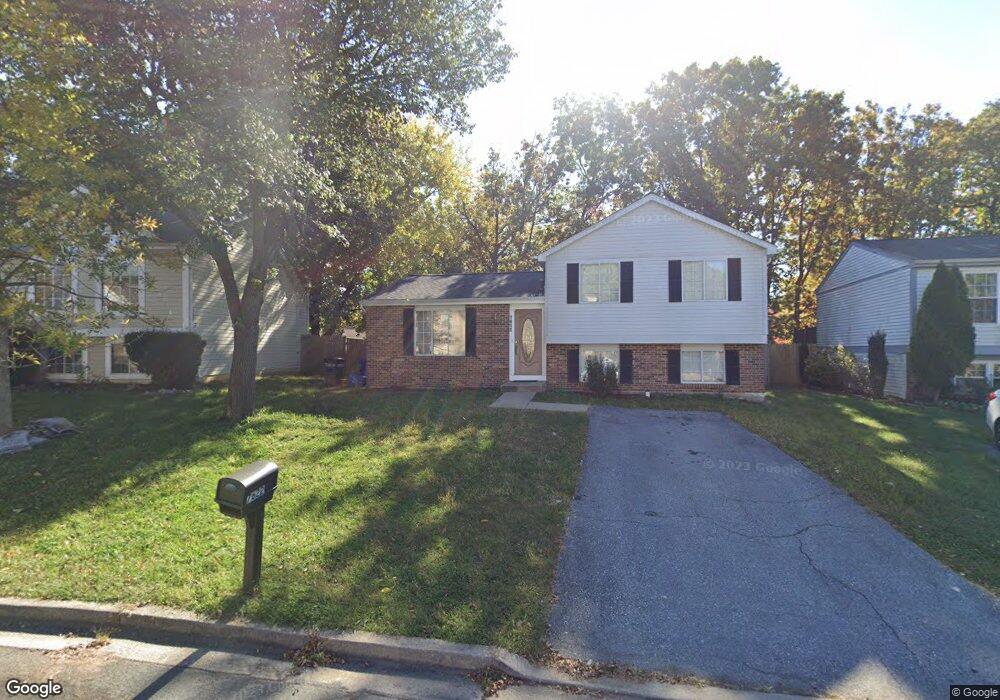
7675 Laytonia Dr Gaithersburg, MD 20877
Estimated Value: $287,000 - $332,000
--
Bed
2
Baths
1,350
Sq Ft
$229/Sq Ft
Est. Value
About This Home
This home is located at 7675 Laytonia Dr, Gaithersburg, MD 20877 and is currently estimated at $309,494, approximately $229 per square foot. 7675 Laytonia Dr is a home located in Montgomery County with nearby schools including Mill Creek Towne Elementary School, Shady Grove Middle School, and Col. Zadok Magruder High School.
Ownership History
Date
Name
Owned For
Owner Type
Purchase Details
Closed on
Nov 16, 2009
Sold by
Perez Fani J
Bought by
Perez Feliberto
Current Estimated Value
Purchase Details
Closed on
Apr 19, 2006
Sold by
Perez Fani J
Bought by
Perez Fani J
Purchase Details
Closed on
Mar 17, 2006
Sold by
Perez Fani J
Bought by
Perez Fani J
Purchase Details
Closed on
Dec 7, 2005
Sold by
Eros Lav and Eros Octavio
Bought by
Perez Fani J
Purchase Details
Closed on
Sep 6, 2002
Sold by
Eros Lav and Eros Octavio
Bought by
Perez Fani J
Purchase Details
Closed on
Sep 10, 1999
Sold by
Wu Song Q
Bought by
Lavanderos Octavio
Purchase Details
Closed on
Nov 4, 1997
Sold by
Li Zi Z
Bought by
Wu Song Q
Purchase Details
Closed on
Sep 4, 1997
Sold by
Li Zi Zhuo
Bought by
Li Zi Z and Wu Song Q
Purchase Details
Closed on
Feb 8, 1996
Sold by
L Charles W and L Haines D
Bought by
Li Zi Zhuo
Create a Home Valuation Report for This Property
The Home Valuation Report is an in-depth analysis detailing your home's value as well as a comparison with similar homes in the area
Home Values in the Area
Average Home Value in this Area
Purchase History
| Date | Buyer | Sale Price | Title Company |
|---|---|---|---|
| Perez Feliberto | -- | -- | |
| Perez Fani J | -- | -- | |
| Perez Fani J | -- | -- | |
| Perez Fani J | -- | -- | |
| Perez Fani J | -- | -- | |
| Lavanderos Octavio | $85,000 | -- | |
| Wu Song Q | -- | -- | |
| Li Zi Z | -- | -- | |
| Li Zi Zhuo | $60,000 | -- |
Source: Public Records
Tax History Compared to Growth
Tax History
| Year | Tax Paid | Tax Assessment Tax Assessment Total Assessment is a certain percentage of the fair market value that is determined by local assessors to be the total taxable value of land and additions on the property. | Land | Improvement |
|---|---|---|---|---|
| 2025 | $3,009 | $245,033 | -- | -- |
| 2024 | $3,009 | $230,467 | $0 | $0 |
| 2023 | $3,514 | $215,900 | $120,000 | $95,900 |
| 2022 | $1,673 | $207,533 | $0 | $0 |
| 2021 | $1,786 | $199,167 | $0 | $0 |
| 2020 | $1,671 | $190,800 | $100,000 | $90,800 |
| 2019 | $1,660 | $190,800 | $100,000 | $90,800 |
| 2018 | $2,693 | $190,800 | $100,000 | $90,800 |
| 2017 | $2,586 | $192,700 | $0 | $0 |
| 2016 | $1,315 | $176,167 | $0 | $0 |
| 2015 | $1,315 | $159,633 | $0 | $0 |
| 2014 | $1,315 | $143,100 | $0 | $0 |
Source: Public Records
Map
Nearby Homes
- 18321 Swan Stream Dr
- 18327 Ivy Oak Terrace
- 17817 Caddy Dr
- 7802 Guildberry Ct Unit 7802-3
- 7911 Badenloch Way Unit 201
- 18411 Guildberry Dr Unit 102
- 7804 Guildberry Ct Unit 202
- 18420 Guildberry Dr Unit 101
- 17805 Park Mill Dr
- 17732 Caddy Dr
- 7906 Pearlbush Dr Unit 7906-3
- 17930 Cottonwood Terrace
- 7902 Badenloch Way Unit 303
- 17813 Cottonwood Terrace
- 18334 Streamside Dr Unit 101
- 18318 Streamside Dr
- 18508 Crabapple Place
- 30 Millcrest Ct
- 18314 Hallmark Ct
- 18574 Cherry Laurel Ln
- 7677 Laytonia Dr
- 7673 Laytonia Dr
- 7679 Laytonia Dr
- 7671 Laytonia Dr
- 7651 Laytonia Dr
- 7649 Laytonia Dr
- 7653 Laytonia Dr
- 7681 Laytonia Dr
- 7647 Laytonia Dr
- 7665 Laytonia Dr
- 7655 Laytonia Dr
- 7669 Laytonia Dr
- 7683 Laytonia Dr
- 7663 Laytonia Dr
- 7685 Laytonia Dr
- 7661 Laytonia Dr
- 7687 Laytonia Dr
- 7622 Creekstone Ct
- 7659 Laytonia Dr
- 7620 Creekstone Ct