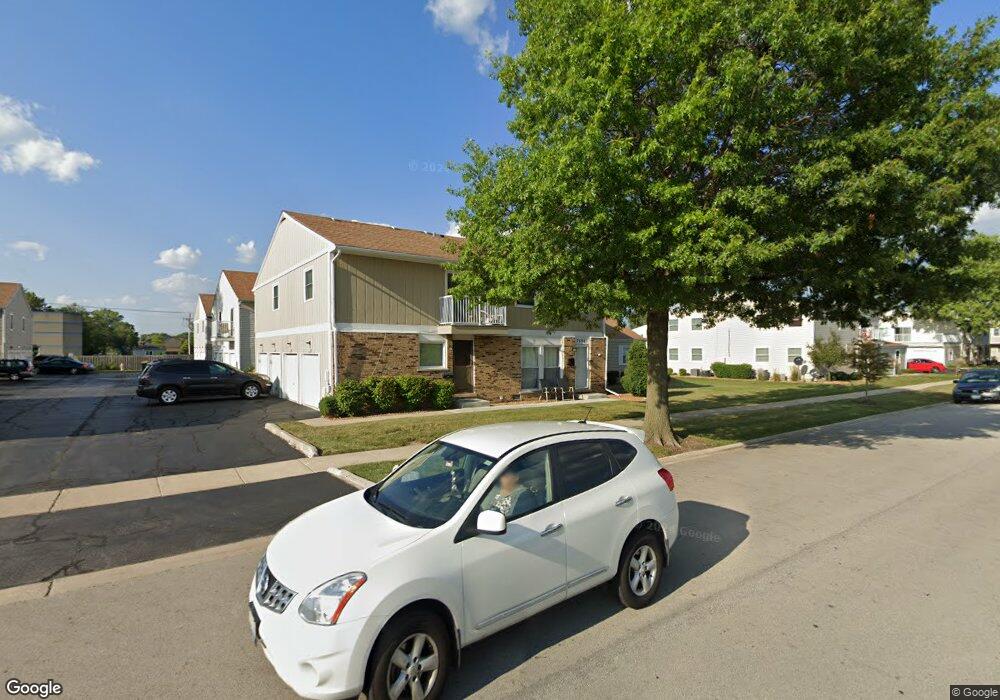
7676 159th Place Unit 41 Tinley Park, IL 60477
Centennial Park NeighborhoodEstimated Value: $175,000 - $217,000
2
Beds
1
Bath
1,100
Sq Ft
$174/Sq Ft
Est. Value
About This Home
This home is located at 7676 159th Place Unit 41, Tinley Park, IL 60477 and is currently estimated at $191,297, approximately $173 per square foot. 7676 159th Place Unit 41 is a home located in Cook County with nearby schools including Helen Keller Elementary School, Virgil I Grissom Middle School, and Victor J Andrew High School.
Ownership History
Date
Name
Owned For
Owner Type
Purchase Details
Closed on
May 5, 2008
Sold by
Deutsche Bank National Trust Co
Bought by
Phipps Tracy and Lopez Andres
Current Estimated Value
Home Financials for this Owner
Home Financials are based on the most recent Mortgage that was taken out on this home.
Original Mortgage
$104,499
Outstanding Balance
$66,144
Interest Rate
5.87%
Mortgage Type
Purchase Money Mortgage
Estimated Equity
$125,153
Purchase Details
Closed on
Nov 8, 2007
Sold by
Olejniczak Phillip and Case #07 Ch 6779
Bought by
Deutsche Bank National Trust Co and Certificateholders Of Soundview Home Loa
Purchase Details
Closed on
Sep 28, 2001
Sold by
Baltakis Florence
Bought by
Olejniczak Phillip and Olejniczak Penny
Home Financials for this Owner
Home Financials are based on the most recent Mortgage that was taken out on this home.
Original Mortgage
$91,105
Interest Rate
10.9%
Purchase Details
Closed on
May 29, 2001
Sold by
Strache Erich D and Strache Victoria M
Bought by
Baltakis Florence
Create a Home Valuation Report for This Property
The Home Valuation Report is an in-depth analysis detailing your home's value as well as a comparison with similar homes in the area
Home Values in the Area
Average Home Value in this Area
Purchase History
| Date | Buyer | Sale Price | Title Company |
|---|---|---|---|
| Phipps Tracy | $110,000 | Fatic | |
| Deutsche Bank National Trust Co | -- | None Available | |
| Olejniczak Phillip | $96,000 | Ticor Title | |
| Baltakis Florence | $92,500 | Burnet Title Llc |
Source: Public Records
Mortgage History
| Date | Status | Borrower | Loan Amount |
|---|---|---|---|
| Open | Phipps Tracy | $104,499 | |
| Previous Owner | Olejniczak Phillip | $91,105 |
Source: Public Records
Tax History Compared to Growth
Tax History
| Year | Tax Paid | Tax Assessment Tax Assessment Total Assessment is a certain percentage of the fair market value that is determined by local assessors to be the total taxable value of land and additions on the property. | Land | Improvement |
|---|---|---|---|---|
| 2024 | $3,233 | $14,961 | $1,391 | $13,570 |
| 2023 | $2,096 | $14,961 | $1,391 | $13,570 |
| 2022 | $2,096 | $9,300 | $927 | $8,373 |
| 2021 | $2,060 | $9,300 | $927 | $8,373 |
| 2020 | $2,083 | $9,300 | $927 | $8,373 |
| 2019 | $2,942 | $12,501 | $869 | $11,632 |
| 2018 | $2,877 | $12,501 | $869 | $11,632 |
| 2017 | $2,819 | $12,501 | $869 | $11,632 |
| 2016 | $2,613 | $10,365 | $811 | $9,554 |
| 2015 | $2,544 | $10,365 | $811 | $9,554 |
| 2014 | $2,540 | $10,365 | $811 | $9,554 |
| 2013 | $2,658 | $11,432 | $811 | $10,621 |
Source: Public Records
Map
Nearby Homes
- 7686 159th Place Unit 38
- 7672 159th Place Unit 42
- 16447 S 76th Ave
- 15957 78th Ave
- 15962 78th Ave
- 15954 78th Ave
- 7809 160th St
- 7732 W 158th Ct Unit 7732
- 15960 Ashford Ct
- 7901 160th St
- 16157 Ozark Ave
- 7533 161st Place
- 7925 160th St
- 7503 161st Place
- 7747 Cashew Dr
- 7911 W 157th St Unit 2W
- 7942 161st St
- 16207 Hamilton Ave
- 16212 Hamilton Ave
- 7405 W 157th St
- 7684 159th Place Unit 36
- 7684 159th Place Unit 7684
- 7684 159th Place
- 7676 159th Place Unit 1
- 7682 159th Place Unit 37
- 7682 159th Place
- 7682 159th Place Unit 7682
- 7688 159th Place Unit 39
- 7674 159th Place Unit 40
- 7674 159th Place Unit 7674
- 7678 159th Place Unit 43
- 7706 159th Place Unit 53
- 7666 159th Place Unit 44
- 7644 159th Place Unit 33
- 7700 159th Place Unit 55
- 7668 159th Place Unit 47
- 7704 159th Place Unit 54
- 7648 159th Place Unit 32
- 7702 159th Place Unit 52