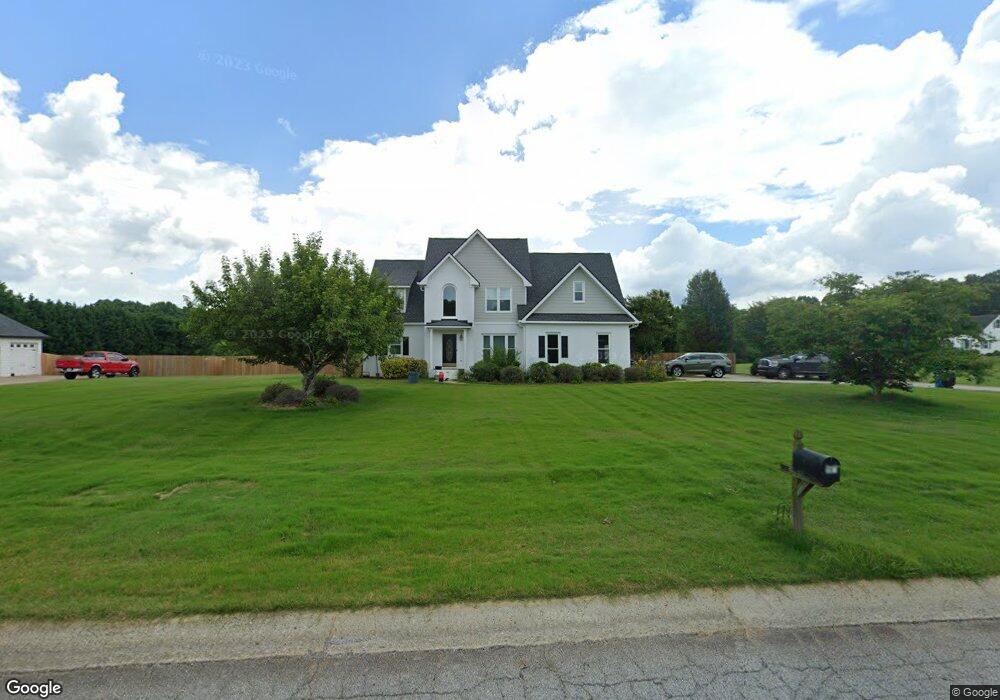
768 Appian Way Unit 4 Statham, GA 30666
Estimated Value: $380,925 - $418,000
4
Beds
3
Baths
2,182
Sq Ft
$182/Sq Ft
Est. Value
About This Home
This home is located at 768 Appian Way Unit 4, Statham, GA 30666 and is currently estimated at $396,231, approximately $181 per square foot. 768 Appian Way Unit 4 is a home located in Barrow County with nearby schools including Bethlehem Elementary School, Haymon-Morris Middle School, and Apalachee High School.
Ownership History
Date
Name
Owned For
Owner Type
Purchase Details
Closed on
Jan 20, 2022
Sold by
Gilley Brady Otis
Bought by
Hirano Ryan and Landmesser Kelly
Current Estimated Value
Home Financials for this Owner
Home Financials are based on the most recent Mortgage that was taken out on this home.
Original Mortgage
$288,000
Outstanding Balance
$266,587
Interest Rate
3.45%
Mortgage Type
Cash
Estimated Equity
$129,644
Purchase Details
Closed on
Jul 8, 1999
Sold by
Warren Massey Homes Inc
Bought by
Gilley Brady and Gilley Sharon
Purchase Details
Closed on
Oct 26, 1995
Bought by
Massey Warren Homes
Create a Home Valuation Report for This Property
The Home Valuation Report is an in-depth analysis detailing your home's value as well as a comparison with similar homes in the area
Home Values in the Area
Average Home Value in this Area
Purchase History
| Date | Buyer | Sale Price | Title Company |
|---|---|---|---|
| Hirano Ryan | $320,000 | -- | |
| Gilley Brady | $26,000 | -- | |
| Massey Warren Homes | -- | -- |
Source: Public Records
Mortgage History
| Date | Status | Borrower | Loan Amount |
|---|---|---|---|
| Open | Hirano Ryan | $288,000 |
Source: Public Records
Tax History Compared to Growth
Tax History
| Year | Tax Paid | Tax Assessment Tax Assessment Total Assessment is a certain percentage of the fair market value that is determined by local assessors to be the total taxable value of land and additions on the property. | Land | Improvement |
|---|---|---|---|---|
| 2024 | $3,148 | $125,082 | $24,000 | $101,082 |
| 2023 | $3,155 | $125,682 | $24,000 | $101,682 |
| 2022 | $736 | $79,420 | $16,000 | $63,420 |
| 2021 | $748 | $71,238 | $16,000 | $55,238 |
| 2020 | $2,127 | $71,238 | $16,000 | $55,238 |
| 2019 | $765 | $71,238 | $16,000 | $55,238 |
| 2018 | $697 | $67,238 | $12,000 | $55,238 |
| 2017 | $1,642 | $56,392 | $12,000 | $44,392 |
| 2016 | $535 | $54,692 | $12,000 | $42,692 |
| 2015 | $544 | $55,181 | $12,000 | $43,181 |
| 2014 | -- | $51,315 | $7,644 | $43,671 |
| 2013 | -- | $48,136 | $7,644 | $40,492 |
Source: Public Records
Map
Nearby Homes
- 112 Shallow Way
- 1190 Foster Rd
- 0 Perkins Rd Unit 10623675
- 0 Perkins Rd Unit 7664605
- 0 Wall Rd Unit 10504981
- 0 Wall Rd Unit 7564754
- 572 Elder Rd SE
- 568 Elder Rd SE
- 564 Elder Rd SE
- 576 Elder Rd SE
- 223 Westlyn Way
- 63 Westlyn Way
- 66 Westlyn Way
- The Landon II Plan at Westlyn
- The Baxley Plan at Westlyn
- 61 Westlyn Ln
- 72 Westlyn Ln
- 71 Westlyn Ln
- 163 Westlyn Way
- 768 Appian Way
- 764 Appian Way
- 774 Appian Way
- 0 Appian Way Unit 8531679
- 111 Flowering Heather
- 111 Flowing Heather Crossing
- 776 Appian Way
- 769 Appian Way
- 765 Appian Way
- 760 Appian Way
- 773 Appian Way
- 761 Appian Way Unit POPLAR
- 107 Flowing Heather Crossing
- 849 Wall Rd
- 778 Appian Way
- 777 Appian Way
- 759 Appian Way
- 758 Appian Way
- 107 Flowering Heather
- 756 Appian Way