768 Botany Loop Murrells Inlet, SC 29576
Burgess NeighborhoodEstimated Value: $385,000 - $394,000
3
Beds
3
Baths
2,001
Sq Ft
$195/Sq Ft
Est. Value
About This Home
This home is located at 768 Botany Loop, Murrells Inlet, SC 29576 and is currently estimated at $389,616, approximately $194 per square foot. 768 Botany Loop is a home located in Horry County with nearby schools including St. James Elementary School, St. James Intermediate, and St. James High School.
Ownership History
Date
Name
Owned For
Owner Type
Purchase Details
Closed on
May 5, 2021
Sold by
Dickerson Linda J
Bought by
Spencer Randy B and Weaver Kathy J
Current Estimated Value
Home Financials for this Owner
Home Financials are based on the most recent Mortgage that was taken out on this home.
Original Mortgage
$140,000
Outstanding Balance
$125,518
Interest Rate
3.1%
Mortgage Type
New Conventional
Estimated Equity
$264,098
Purchase Details
Closed on
Aug 12, 2014
Sold by
Dickerson Bruce R
Bought by
Dickerson Linda J
Purchase Details
Closed on
May 8, 2009
Sold by
Citibank Na
Bought by
Dickerson Bruce R
Purchase Details
Closed on
Dec 22, 2008
Sold by
Master In Equity Horry County
Bought by
Citibank
Purchase Details
Closed on
May 27, 2005
Sold by
St Johns At The Bays Llc
Bought by
Deagan William J
Home Financials for this Owner
Home Financials are based on the most recent Mortgage that was taken out on this home.
Original Mortgage
$212,602
Interest Rate
6.75%
Mortgage Type
Fannie Mae Freddie Mac
Create a Home Valuation Report for This Property
The Home Valuation Report is an in-depth analysis detailing your home's value as well as a comparison with similar homes in the area
Home Values in the Area
Average Home Value in this Area
Purchase History
| Date | Buyer | Sale Price | Title Company |
|---|---|---|---|
| Spencer Randy B | $279,900 | -- | |
| Dickerson Linda J | -- | -- | |
| Dickerson Bruce R | $151,000 | -- | |
| Citibank | $120,000 | -- | |
| Deagan William J | $237,639 | -- |
Source: Public Records
Mortgage History
| Date | Status | Borrower | Loan Amount |
|---|---|---|---|
| Open | Spencer Randy B | $140,000 | |
| Previous Owner | Deagan William J | $212,602 |
Source: Public Records
Tax History
| Year | Tax Paid | Tax Assessment Tax Assessment Total Assessment is a certain percentage of the fair market value that is determined by local assessors to be the total taxable value of land and additions on the property. | Land | Improvement |
|---|---|---|---|---|
| 2025 | $4,882 | $0 | $0 | $0 |
| 2024 | $4,882 | $24,192 | $6,600 | $17,592 |
| 2023 | $4,882 | $12,365 | $2,351 | $10,014 |
| 2021 | $4,192 | $12,510 | $2,496 | $10,014 |
| 2020 | $2,500 | $12,510 | $2,496 | $10,014 |
| 2019 | $2,500 | $8,340 | $1,664 | $6,676 |
| 2018 | $2,254 | $7,168 | $1,340 | $5,828 |
| 2017 | $2,239 | $10,752 | $2,010 | $8,742 |
| 2016 | -- | $10,752 | $2,010 | $8,742 |
| 2015 | $2,239 | $10,752 | $2,010 | $8,742 |
| 2014 | $2,118 | $10,752 | $2,010 | $8,742 |
Source: Public Records
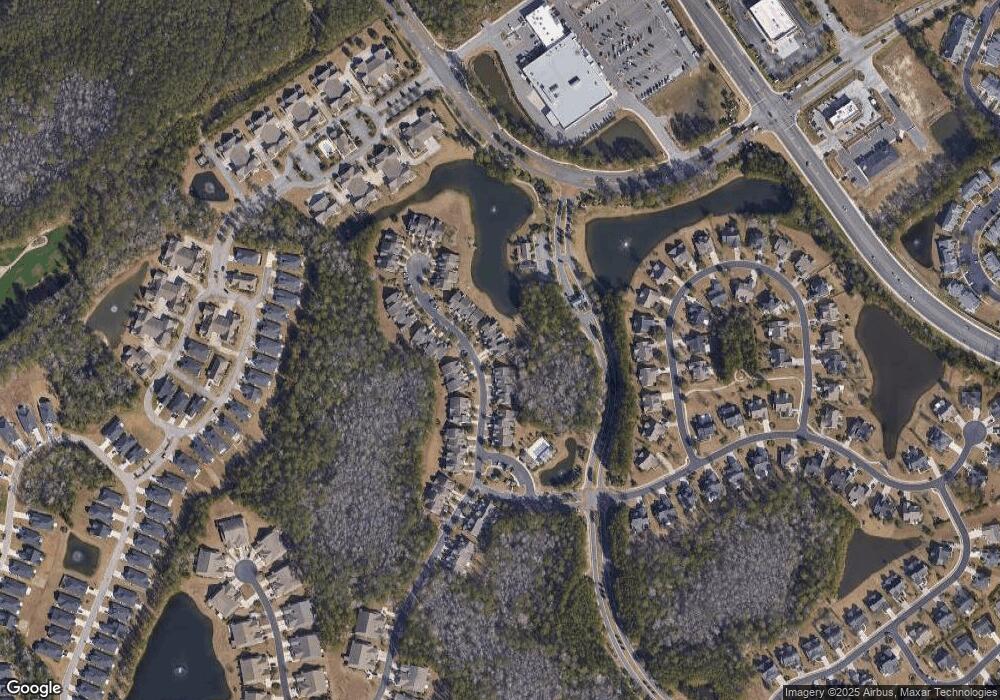
Map
Nearby Homes
- 715 Botany Loop Unit 49
- 803 Botany Loop
- 815 Botany Loop
- 436 Arlington Cir
- 641 Botany Loop Unit 63
- 654 Misty Hammock Dr Unit 654
- 361 Green Creek Bay Cir
- 353 Green Creek Bay Cir
- 352 Arlington Cir
- 600 Elmwood Cir
- 301 Bent Green Ct Unit 301
- 517 Ryegrass Way
- 517 Ryegrass Way Unit 14H
- 200 Bent Green Ct Unit 43A
- 208 Bent Green Ct Unit 43C
- 204 Bent Green Ct Unit 43B
- 216 Bent Green Ct Unit 43E
- 212 Bent Green Ct Unit 43D
- 693 Wilshire Ln
- 570 Botany Loop Unit 570
- 768 Botany Loop
- 772 Botany Loop
- 776 Botany Loop
- 776 Botany Loop Unit 11
- 776 Botany Bay Loop
- 764 Botany Loop Unit 8
- 780 Botany Loop
- 780 Botany Loop
- 760 Botany Loop
- 784 Botany Loop
- 756 Botany Loop
- 788 Botany Loop
- 788 Botany Loop Unit 14A
- 752 Botany Loop
- 769 Botany Bay Loop Unit 38
- 769 Botany Bay Loop
- 773 Botany Loop Unit 37E
- 769 Botany Loop
- 765 Botany Loop
- 792 Botany Loop
Your Personal Tour Guide
Ask me questions while you tour the home.