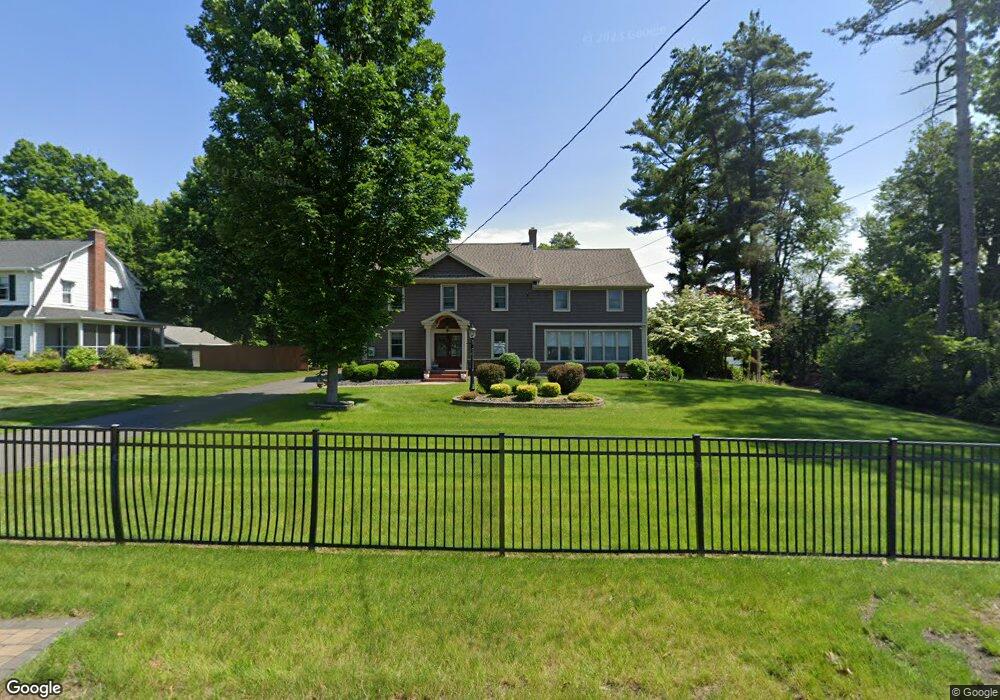
768 East St Ludlow, MA 01056
Estimated Value: $428,000 - $724,000
4
Beds
3
Baths
2,814
Sq Ft
$198/Sq Ft
Est. Value
About This Home
This home is located at 768 East St, Ludlow, MA 01056 and is currently estimated at $558,367, approximately $198 per square foot. 768 East St is a home located in Hampden County with nearby schools including East Street Elementary School, Chapin Street Elementary School, and Paul R. Baird Middle School.
Ownership History
Date
Name
Owned For
Owner Type
Purchase Details
Closed on
Jul 17, 2025
Sold by
Vieira Marco M and Vieira Jessica R
Bought by
Vieira Ft and Vieira
Current Estimated Value
Purchase Details
Closed on
Oct 8, 2021
Sold by
Mazur Kim I
Bought by
Vieira Marco and Vieira Jessica
Purchase Details
Closed on
Apr 13, 2017
Sold by
Vieira Family Properti
Bought by
Vieira Marco M and Vieira Jessica R
Purchase Details
Closed on
Jan 26, 2017
Sold by
Vieira Family Props Ll
Bought by
Vieira Family Props Ll
Purchase Details
Closed on
Oct 7, 2015
Sold by
Ziemian Genevieve L
Bought by
Vieira Family Properti
Home Financials for this Owner
Home Financials are based on the most recent Mortgage that was taken out on this home.
Original Mortgage
$184,800
Interest Rate
3.88%
Mortgage Type
Commercial
Create a Home Valuation Report for This Property
The Home Valuation Report is an in-depth analysis detailing your home's value as well as a comparison with similar homes in the area
Home Values in the Area
Average Home Value in this Area
Purchase History
| Date | Buyer | Sale Price | Title Company |
|---|---|---|---|
| Vieira Ft | -- | -- | |
| Vieira Ft | -- | -- | |
| Vieira Marco | -- | None Available | |
| Vieira Marco | -- | None Available | |
| Vieira Marco M | -- | -- | |
| Vieira Marco M | -- | -- | |
| Vieira Family Props Ll | -- | -- | |
| Vieira Family Props Ll | -- | -- | |
| Vieira Family Properti | $231,000 | -- | |
| Vieira Family Properti | $231,000 | -- |
Source: Public Records
Mortgage History
| Date | Status | Borrower | Loan Amount |
|---|---|---|---|
| Previous Owner | Vieira Family Properti | $184,800 |
Source: Public Records
Tax History
| Year | Tax Paid | Tax Assessment Tax Assessment Total Assessment is a certain percentage of the fair market value that is determined by local assessors to be the total taxable value of land and additions on the property. | Land | Improvement |
|---|---|---|---|---|
| 2025 | $7,280 | $419,600 | $111,400 | $308,200 |
| 2024 | $7,008 | $387,400 | $111,300 | $276,100 |
| 2023 | $6,821 | $349,600 | $97,700 | $251,900 |
| 2022 | $6,357 | $318,000 | $97,700 | $220,300 |
| 2021 | $6,404 | $303,800 | $99,700 | $204,100 |
| 2020 | $6,134 | $297,500 | $98,200 | $199,300 |
| 2019 | $5,490 | $277,000 | $97,200 | $179,800 |
| 2018 | $5,148 | $270,800 | $97,200 | $173,600 |
| 2017 | $4,853 | $261,900 | $95,300 | $166,600 |
| 2016 | $4,371 | $241,100 | $93,400 | $147,700 |
| 2015 | $4,101 | $237,200 | $92,400 | $144,800 |
Source: Public Records
Map
Nearby Homes
- 25 Dale St
- 374 East St
- 31 Greenwich St
- 259 Prospect St
- 37 Franklin St
- 59 Prospect St
- 162 Highland Ave
- 287 East St
- 70 Sroka Ln
- 63 Oak St
- 125 Pondview Dr
- 84 Chapin Greene Dr
- 517 Ideal Ln Unit 401
- 2205 Boston Rd Unit Q160
- 308 Miller St Unit 79
- 308 Miller St Unit 78
- 308 Miller St Unit 6
- 229 Miller St Unit F-13
- 229 Miller St Unit C-1
- 229 Miller St Unit E-6
Your Personal Tour Guide
Ask me questions while you tour the home.