Estimated Value: $121,000 - $264,000
Studio
2
Baths
1,086
Sq Ft
$162/Sq Ft
Est. Value
About This Home
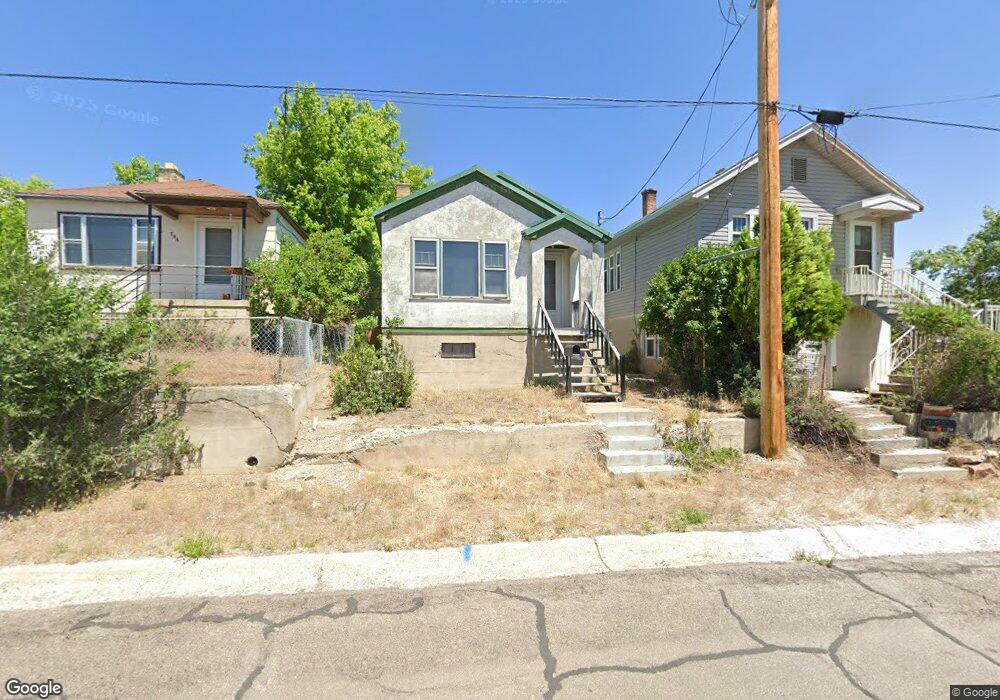
This home is located at 768 High St, Ely, NV 89301 and is currently estimated at $175,914, approximately $161 per square foot. 768 High St is a home located in White Pine County with nearby schools including David E. Norman Elementary School, White Pine Middle School, and White Pine High School.
Ownership History
Date
Name
Owned For
Owner Type
Purchase Details
Closed on
Jun 18, 2025
Sold by
Af Rental Properties Llc
Bought by
Bka Investments Llc
Current Estimated Value
Home Financials for this Owner
Home Financials are based on the most recent Mortgage that was taken out on this home.
Original Mortgage
$150,000
Outstanding Balance
$149,611
Interest Rate
6.76%
Mortgage Type
Seller Take Back
Estimated Equity
$26,303
Purchase Details
Closed on
Aug 7, 2018
Sold by
Hexem Karl A
Bought by
Af Rental Properties Llc
Create a Home Valuation Report for This Property
The Home Valuation Report is an in-depth analysis detailing your home's value as well as a comparison with similar homes in the area
Home Values in the Area
Average Home Value in this Area
Purchase History
| Date | Buyer | Sale Price | Title Company |
|---|---|---|---|
| Bka Investments Llc | $250,000 | First American Title | |
| Af Rental Properties Llc | $38,809 | None Available |
Source: Public Records
Mortgage History
| Date | Status | Borrower | Loan Amount |
|---|---|---|---|
| Open | Bka Investments Llc | $150,000 |
Source: Public Records
Tax History
| Year | Tax Paid | Tax Assessment Tax Assessment Total Assessment is a certain percentage of the fair market value that is determined by local assessors to be the total taxable value of land and additions on the property. | Land | Improvement |
|---|---|---|---|---|
| 2025 | $727 | $19,464 | $1,514 | $17,950 |
| 2024 | $727 | $19,130 | $1,356 | $17,774 |
| 2023 | $727 | $17,404 | $1,356 | $16,048 |
| 2022 | $634 | $15,348 | $1,181 | $14,167 |
| 2021 | $601 | $14,443 | $1,181 | $13,262 |
| 2020 | $615 | $14,823 | $1,181 | $13,642 |
| 2019 | $588 | $14,143 | $1,181 | $12,962 |
| 2018 | $554 | $13,583 | $1,181 | $12,402 |
| 2017 | $534 | $13,240 | $1,076 | $12,164 |
| 2016 | $520 | $12,137 | $1,076 | $11,061 |
| 2015 | $440 | $12,027 | $1,076 | $10,951 |
| 2014 | $440 | $12,014 | $1,278 | $10,736 |
Source: Public Records
Map
Nearby Homes
Your Personal Tour Guide
Ask me questions while you tour the home.