Estimated Value: $123,000 - $132,561
2
Beds
1
Bath
1,292
Sq Ft
$99/Sq Ft
Est. Value
About This Home
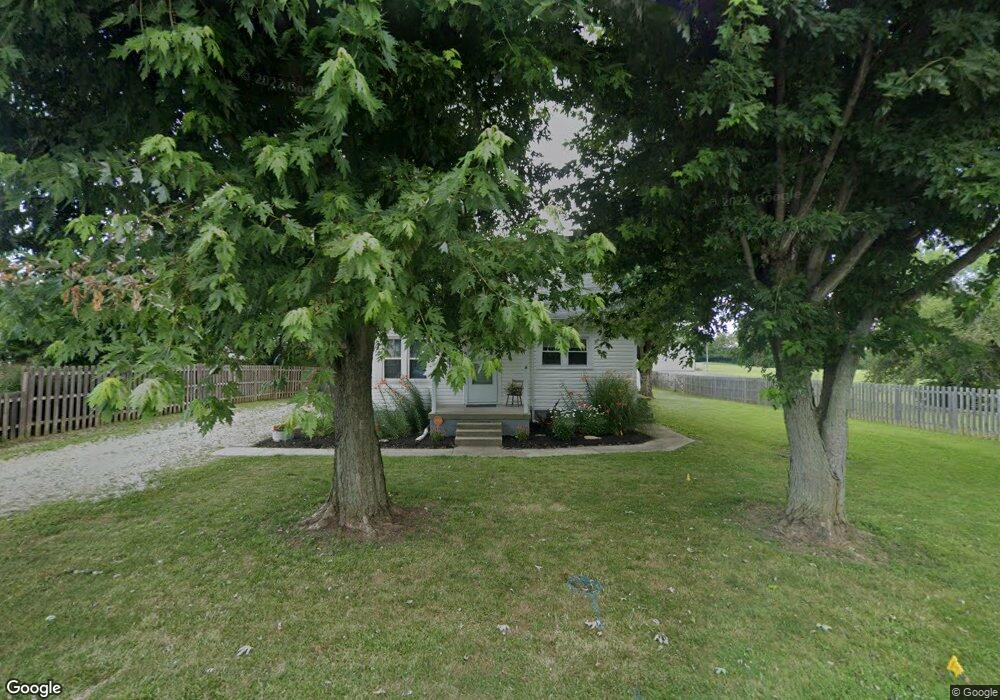
This home is located at 768 Lynn St, Xenia, OH 45385 and is currently estimated at $127,640, approximately $98 per square foot. 768 Lynn St is a home located in Greene County with nearby schools including Xenia High School, Summit Academy Community School for Alternative Learners - Xenia, and Legacy Christian Academy.
Ownership History
Date
Name
Owned For
Owner Type
Purchase Details
Closed on
May 10, 2022
Sold by
Stewart Gina R and Bogie Gina R
Bought by
Riley Lori A
Current Estimated Value
Home Financials for this Owner
Home Financials are based on the most recent Mortgage that was taken out on this home.
Original Mortgage
$58,400
Outstanding Balance
$41,405
Interest Rate
3.91%
Mortgage Type
New Conventional
Estimated Equity
$86,235
Purchase Details
Closed on
Nov 8, 2000
Sold by
Clifton Carl R and Clifton Sandra K
Bought by
Bogie Gina R
Home Financials for this Owner
Home Financials are based on the most recent Mortgage that was taken out on this home.
Original Mortgage
$56,800
Interest Rate
7.87%
Purchase Details
Closed on
Mar 26, 1998
Sold by
Brown Winfred C and Brown Iona J
Bought by
Clifton Carl R
Home Financials for this Owner
Home Financials are based on the most recent Mortgage that was taken out on this home.
Original Mortgage
$52,700
Interest Rate
7.15%
Create a Home Valuation Report for This Property
The Home Valuation Report is an in-depth analysis detailing your home's value as well as a comparison with similar homes in the area
Home Values in the Area
Average Home Value in this Area
Purchase History
| Date | Buyer | Sale Price | Title Company |
|---|---|---|---|
| Riley Lori A | -- | Safemark Title | |
| Bogie Gina R | $71,000 | -- | |
| Clifton Carl R | $65,900 | -- |
Source: Public Records
Mortgage History
| Date | Status | Borrower | Loan Amount |
|---|---|---|---|
| Open | Riley Lori A | $58,400 | |
| Previous Owner | Bogie Gina R | $56,800 | |
| Previous Owner | Clifton Carl R | $52,700 |
Source: Public Records
Tax History Compared to Growth
Tax History
| Year | Tax Paid | Tax Assessment Tax Assessment Total Assessment is a certain percentage of the fair market value that is determined by local assessors to be the total taxable value of land and additions on the property. | Land | Improvement |
|---|---|---|---|---|
| 2024 | $1,544 | $36,090 | $5,720 | $30,370 |
| 2023 | $1,544 | $36,090 | $5,720 | $30,370 |
| 2022 | $1,347 | $27,490 | $4,570 | $22,920 |
| 2021 | $1,365 | $27,490 | $4,570 | $22,920 |
| 2020 | $1,363 | $27,490 | $4,570 | $22,920 |
| 2019 | $1,363 | $26,980 | $5,710 | $21,270 |
| 2018 | $1,368 | $26,980 | $5,710 | $21,270 |
| 2017 | $1,321 | $26,980 | $5,710 | $21,270 |
| 2016 | $1,322 | $25,590 | $5,710 | $19,880 |
| 2015 | $663 | $25,590 | $5,710 | $19,880 |
| 2014 | $634 | $25,590 | $5,710 | $19,880 |
Source: Public Records
Map
Nearby Homes
- 633 Xenia Ave
- 46 Lake St
- 55 Lake St
- 100 Prugh Ave
- 293 S Miami Ave
- 530 Cincinnati Ave
- 453 Walnut St
- 148 Home Ave
- 260 Pocahontas St
- 400 S Detroit St
- 523 Newport Rd
- 305-325 Bellbrook Ave
- 222 Washington St
- 36 Leaman St
- 75 W 2nd St
- 373 Hill St
- 0 W Church St
- 1208 Bellbrook Ave
- 214 Corwin Ave
- 1272 Bellbrook Ave