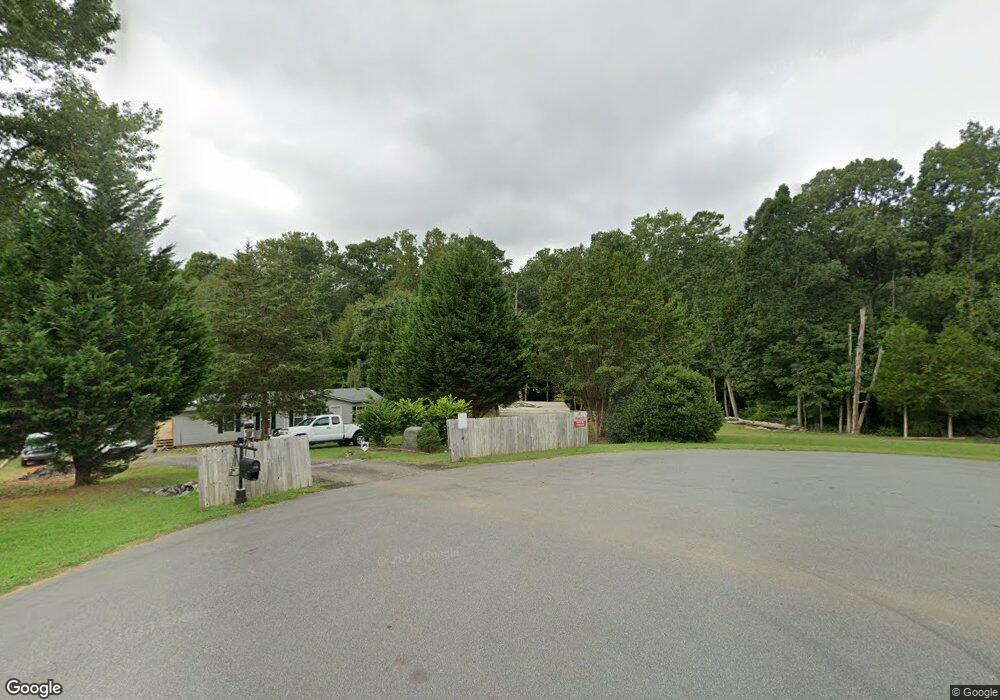
768 Spring Creek Dr Iron Station, NC 28080
Estimated Value: $216,000 - $247,000
3
Beds
2
Baths
1,772
Sq Ft
$132/Sq Ft
Est. Value
About This Home
This home is located at 768 Spring Creek Dr, Iron Station, NC 28080 and is currently estimated at $233,333, approximately $131 per square foot. 768 Spring Creek Dr is a home located in Lincoln County with nearby schools including Catawba Springs Elementary School, East Lincoln Middle School, and East Lincoln High School.
Ownership History
Date
Name
Owned For
Owner Type
Purchase Details
Closed on
Sep 9, 2009
Sold by
Green Tree Servicing Llc
Bought by
Poplin Jennifer N and Biggerstaff Cody D
Current Estimated Value
Home Financials for this Owner
Home Financials are based on the most recent Mortgage that was taken out on this home.
Original Mortgage
$66,276
Outstanding Balance
$43,410
Interest Rate
5.22%
Mortgage Type
FHA
Estimated Equity
$189,923
Purchase Details
Closed on
Jul 13, 2009
Sold by
Selbe Romie Lee and Selbe Ronda Totten
Bought by
Green Tree Servicing Llc
Home Financials for this Owner
Home Financials are based on the most recent Mortgage that was taken out on this home.
Original Mortgage
$66,276
Outstanding Balance
$43,410
Interest Rate
5.22%
Mortgage Type
FHA
Estimated Equity
$189,923
Purchase Details
Closed on
Feb 1, 2005
Sold by
Selbe Ronda T
Bought by
Pinnacle Plus Property Investments Inc
Purchase Details
Closed on
Oct 24, 1996
Bought by
Selbe Romie Lee and Ronda Totten
Create a Home Valuation Report for This Property
The Home Valuation Report is an in-depth analysis detailing your home's value as well as a comparison with similar homes in the area
Home Values in the Area
Average Home Value in this Area
Purchase History
| Date | Buyer | Sale Price | Title Company |
|---|---|---|---|
| Poplin Jennifer N | $67,500 | None Available | |
| Green Tree Servicing Llc | $59,000 | None Available | |
| Pinnacle Plus Property Investments Inc | -- | None Available | |
| Selbe Romie Lee | $22,500 | -- |
Source: Public Records
Mortgage History
| Date | Status | Borrower | Loan Amount |
|---|---|---|---|
| Open | Poplin Jennifer N | $66,276 |
Source: Public Records
Tax History Compared to Growth
Tax History
| Year | Tax Paid | Tax Assessment Tax Assessment Total Assessment is a certain percentage of the fair market value that is determined by local assessors to be the total taxable value of land and additions on the property. | Land | Improvement |
|---|---|---|---|---|
| 2025 | $1,127 | $159,462 | $32,680 | $126,782 |
| 2024 | $1,107 | $159,462 | $32,680 | $126,782 |
| 2023 | $1,081 | $159,462 | $32,680 | $126,782 |
| 2022 | $760 | $87,629 | $26,744 | $60,885 |
| 2021 | $760 | $87,629 | $26,744 | $60,885 |
| 2020 | $627 | $87,629 | $26,744 | $60,885 |
| 2019 | $627 | $87,629 | $26,744 | $60,885 |
| 2018 | $679 | $79,394 | $21,500 | $57,894 |
| 2017 | $578 | $79,394 | $21,500 | $57,894 |
| 2016 | $578 | $79,394 | $21,500 | $57,894 |
| 2015 | $652 | $79,394 | $21,500 | $57,894 |
| 2014 | $635 | $77,970 | $25,500 | $52,470 |
Source: Public Records
Map
Nearby Homes
- 1785 Doe Ct
- 1789 Doe Ct
- 0 Oak Park Ct Unit 17
- 1615 Oak Park Ct
- 1713 Oak Park Ct
- 0 Wolf Rd Unit 8
- 0 Highway 73 Hwy Unit CAR4276388
- 5716 Dalmatian St
- 5039 Penn Rd
- 450 Greywalls Ln
- Lot #42 Sardis Ct
- 5748 Dalmatian St
- 5756 Dalmatian St
- 0 Lhasa Apso Ln Unit CAR4157960
- 0 Lhasa Apso Ln Unit CAR4157956
- 0 Dalmatian St Unit CAR4157812
- 5843 Dachshund St
- 0 Great Dane Ave Unit CAR4157929
- 5756 Rumfelt Rd
- 4859 Paysour Pond Rd
- 774 Spring Creek Dr
- 775 Spring Creek Dr
- 758 Spring Creek Dr
- 765 Spring Creek Dr
- 815 Mount Zion Church Rd
- 748 Spring Creek Dr
- 734 Spring Creek Dr
- 5730 High Plains Ct
- 739 Spring Creek Dr
- 832 Monterey Dr
- 720 Spring Creek Dr
- 846 Monterey Dr
- 858 Monterey Dr
- 818 Monterey Dr
- 5739 High Plains Ct
- 5732 High Plains Ct
- 870 Monterey Dr
- 767 Mount Zion Church Rd
- 721 Spring Creek Dr
- 5745 High Plains Ct