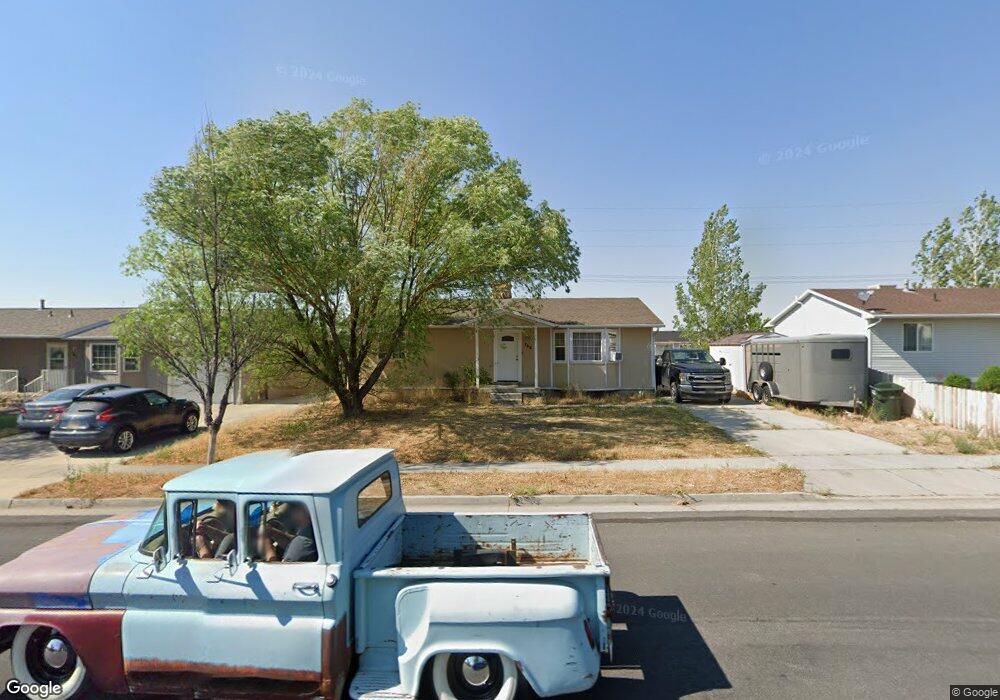
768 Timpie Rd Tooele, UT 84074
Estimated Value: $391,663 - $412,000
4
Beds
2
Baths
2,200
Sq Ft
$182/Sq Ft
Est. Value
About This Home
This home is located at 768 Timpie Rd, Tooele, UT 84074 and is currently estimated at $399,916, approximately $181 per square foot. 768 Timpie Rd is a home located in Tooele County with nearby schools including Settlement Canyon Elementary School, Tooele Junior High School, and Tooele High School.
Ownership History
Date
Name
Owned For
Owner Type
Purchase Details
Closed on
Nov 9, 2016
Sold by
Taylor Annette F and Taylor Annette
Bought by
Hatch Trevor I
Current Estimated Value
Home Financials for this Owner
Home Financials are based on the most recent Mortgage that was taken out on this home.
Original Mortgage
$178,686
Outstanding Balance
$143,454
Interest Rate
3.42%
Mortgage Type
New Conventional
Estimated Equity
$256,462
Purchase Details
Closed on
Sep 22, 2012
Sold by
Taylor Thomas G
Bought by
Taylor Annette
Create a Home Valuation Report for This Property
The Home Valuation Report is an in-depth analysis detailing your home's value as well as a comparison with similar homes in the area
Purchase History
| Date | Buyer | Sale Price | Title Company |
|---|---|---|---|
| Hatch Trevor I | -- | Sutherland Title Company | |
| Taylor Annette | -- | None Available |
Source: Public Records
Mortgage History
| Date | Status | Borrower | Loan Amount |
|---|---|---|---|
| Open | Hatch Trevor I | $178,686 |
Source: Public Records
Tax History
| Year | Tax Paid | Tax Assessment Tax Assessment Total Assessment is a certain percentage of the fair market value that is determined by local assessors to be the total taxable value of land and additions on the property. | Land | Improvement |
|---|---|---|---|---|
| 2025 | $2,496 | $378,495 | $103,750 | $274,745 |
| 2024 | $2,649 | $202,172 | $57,063 | $145,109 |
| 2023 | $2,649 | $203,288 | $54,342 | $148,946 |
| 2022 | $2,484 | $213,734 | $67,678 | $146,056 |
| 2021 | $1,992 | $143,382 | $21,691 | $121,691 |
| 2020 | $1,901 | $237,334 | $39,438 | $197,896 |
| 2019 | $1,789 | $219,637 | $39,438 | $180,199 |
| 2018 | $1,616 | $188,204 | $35,000 | $153,204 |
| 2017 | $1,309 | $180,909 | $35,000 | $145,909 |
| 2016 | $853 | $69,245 | $12,375 | $56,870 |
| 2015 | $853 | $62,059 | $0 | $0 |
| 2014 | -- | $62,059 | $0 | $0 |
Source: Public Records
Map
Nearby Homes
Your Personal Tour Guide
Ask me questions while you tour the home.