Estimated Value: $231,000 - $312,000
3
Beds
1
Bath
1,327
Sq Ft
$203/Sq Ft
Est. Value
About This Home
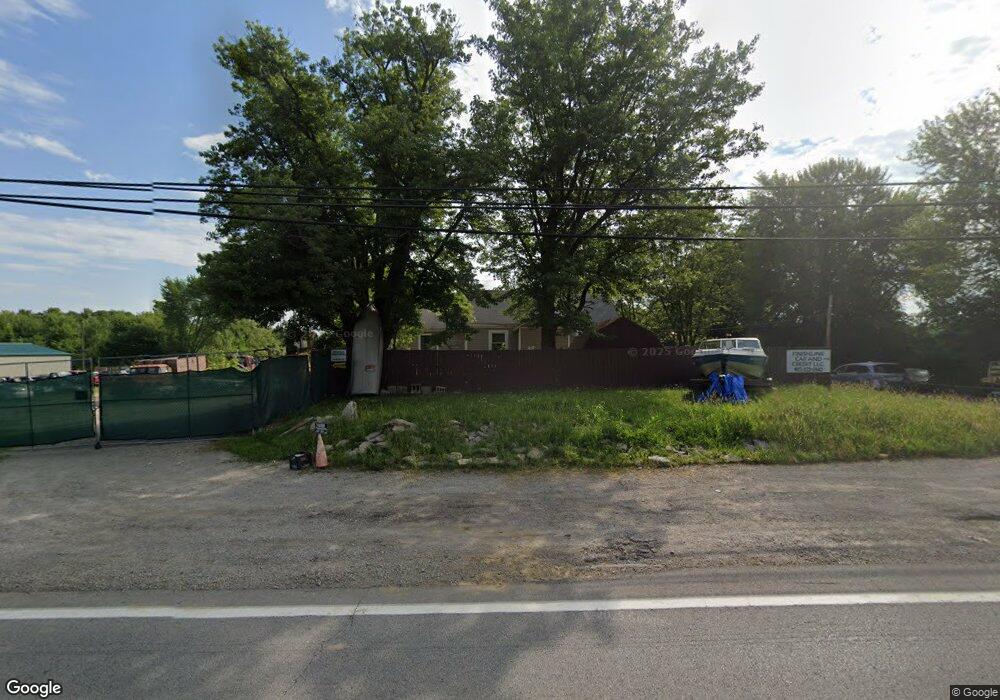
This home is located at 768 Us Route 68 S, Xenia, OH 45385 and is currently estimated at $269,952, approximately $203 per square foot. 768 Us Route 68 S is a home located in Greene County with nearby schools including Xenia High School, Summit Academy Community School for Alternative Learners - Xenia, and Legacy Christian Academy.
Ownership History
Date
Name
Owned For
Owner Type
Purchase Details
Closed on
Jul 1, 2021
Sold by
Sherod Trina
Bought by
Stratton Oakmont Properties Llc
Current Estimated Value
Purchase Details
Closed on
Mar 16, 2016
Sold by
Fannie Mae
Bought by
Sherod Trina
Purchase Details
Closed on
Dec 23, 2015
Bought by
Fannie Mae
Purchase Details
Closed on
Mar 27, 2007
Sold by
Hill Joseph and Hill Ann
Bought by
Hill Joseph M and Hill Anna M
Purchase Details
Closed on
Jan 5, 1999
Sold by
Hartley Brenda M and Mcguire Brenda M
Bought by
Hill Joseph and Hill Ann
Home Financials for this Owner
Home Financials are based on the most recent Mortgage that was taken out on this home.
Original Mortgage
$84,800
Interest Rate
6.92%
Create a Home Valuation Report for This Property
The Home Valuation Report is an in-depth analysis detailing your home's value as well as a comparison with similar homes in the area
Home Values in the Area
Average Home Value in this Area
Purchase History
| Date | Buyer | Sale Price | Title Company |
|---|---|---|---|
| Stratton Oakmont Properties Llc | $110,000 | None Available | |
| Sherod Trina | -- | None Available | |
| Fannie Mae | -- | -- | |
| Hill Joseph M | -- | None Available | |
| Hill Joseph | $106,000 | -- |
Source: Public Records
Mortgage History
| Date | Status | Borrower | Loan Amount |
|---|---|---|---|
| Previous Owner | Hill Joseph | $84,800 |
Source: Public Records
Tax History Compared to Growth
Tax History
| Year | Tax Paid | Tax Assessment Tax Assessment Total Assessment is a certain percentage of the fair market value that is determined by local assessors to be the total taxable value of land and additions on the property. | Land | Improvement |
|---|---|---|---|---|
| 2024 | $3,455 | $71,080 | $28,600 | $42,480 |
| 2023 | $3,455 | $71,080 | $28,600 | $42,480 |
| 2022 | $3,101 | $57,820 | $24,860 | $32,960 |
| 2021 | $3,140 | $57,820 | $24,860 | $32,960 |
| 2020 | $3,018 | $57,820 | $24,860 | $32,960 |
| 2019 | $2,406 | $43,280 | $21,970 | $21,310 |
| 2018 | $2,415 | $43,280 | $21,970 | $21,310 |
| 2017 | $2,679 | $43,280 | $21,970 | $21,310 |
| 2016 | $2,375 | $41,860 | $21,440 | $20,420 |
| 2015 | $2,381 | $41,860 | $21,440 | $20,420 |
| 2014 | $2,287 | $41,860 | $21,440 | $20,420 |
Source: Public Records
Map
Nearby Homes