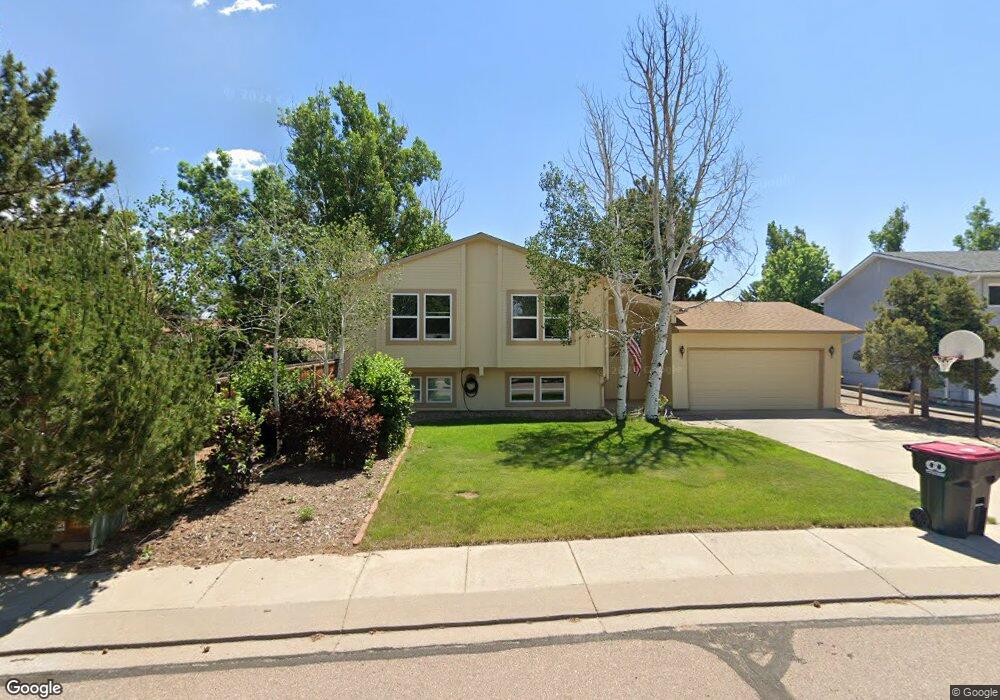
7685 Safari Cir Colorado Springs, CO 80920
Briargate NeighborhoodEstimated Value: $433,031 - $496,000
4
Beds
2
Baths
1,381
Sq Ft
$335/Sq Ft
Est. Value
About This Home
This home is located at 7685 Safari Cir, Colorado Springs, CO 80920 and is currently estimated at $462,008, approximately $334 per square foot. 7685 Safari Cir is a home located in El Paso County with nearby schools including Frontier Elementary School, Mountain Ridge Middle School, and Rampart High School.
Ownership History
Date
Name
Owned For
Owner Type
Purchase Details
Closed on
Nov 27, 2002
Sold by
Mcnaughton Bruce R and Mcnaughton Deborah M
Bought by
Hendrickson Lon A
Current Estimated Value
Home Financials for this Owner
Home Financials are based on the most recent Mortgage that was taken out on this home.
Original Mortgage
$151,400
Outstanding Balance
$65,220
Interest Rate
6.28%
Estimated Equity
$396,788
Purchase Details
Closed on
Jan 14, 2000
Sold by
Hafer Todd R and Hafer Jonell B
Bought by
Mcnaughton Bruce R and Mcnaughton Deborah M
Home Financials for this Owner
Home Financials are based on the most recent Mortgage that was taken out on this home.
Original Mortgage
$128,000
Interest Rate
7.86%
Purchase Details
Closed on
Aug 12, 1993
Bought by
Hendrickson Lon A
Purchase Details
Closed on
Aug 4, 1989
Bought by
Hendrickson Lon A
Purchase Details
Closed on
Oct 1, 1982
Bought by
Hendrickson Lon A
Create a Home Valuation Report for This Property
The Home Valuation Report is an in-depth analysis detailing your home's value as well as a comparison with similar homes in the area
Home Values in the Area
Average Home Value in this Area
Purchase History
| Date | Buyer | Sale Price | Title Company |
|---|---|---|---|
| Hendrickson Lon A | $202,000 | -- | |
| Mcnaughton Bruce R | $160,000 | North American Title Co | |
| Hendrickson Lon A | $121,900 | -- | |
| Hendrickson Lon A | $98,000 | -- | |
| Hendrickson Lon A | -- | -- |
Source: Public Records
Mortgage History
| Date | Status | Borrower | Loan Amount |
|---|---|---|---|
| Open | Hendrickson Lon A | $151,400 | |
| Previous Owner | Mcnaughton Bruce R | $128,000 |
Source: Public Records
Tax History Compared to Growth
Tax History
| Year | Tax Paid | Tax Assessment Tax Assessment Total Assessment is a certain percentage of the fair market value that is determined by local assessors to be the total taxable value of land and additions on the property. | Land | Improvement |
|---|---|---|---|---|
| 2025 | $1,810 | $33,950 | -- | -- |
| 2024 | $1,764 | $32,020 | $5,360 | $26,660 |
| 2022 | $1,702 | $24,110 | $4,340 | $19,770 |
| 2021 | $1,772 | $24,800 | $4,460 | $20,340 |
| 2020 | $1,744 | $22,660 | $3,720 | $18,940 |
| 2019 | $1,726 | $22,660 | $3,720 | $18,940 |
| 2018 | $1,401 | $18,080 | $2,880 | $15,200 |
| 2017 | $1,396 | $18,080 | $2,880 | $15,200 |
| 2016 | $1,358 | $17,560 | $2,930 | $14,630 |
| 2015 | $1,355 | $17,560 | $2,930 | $14,630 |
| 2014 | $1,267 | $16,410 | $2,930 | $13,480 |
Source: Public Records
Map
Nearby Homes
- 7530 Madrid Ct
- 7640 Gibralter Dr
- 7420 Lomas Ct
- 7430 Lomas Ct
- 3339 Union Jack Way
- 2768 Thrush Grove
- 3315 Mexico Ct
- 8146 Horizon Dr
- 2553 Legend Dr
- 3326 Soaring Bird Cir
- 7849 Flicker Grove
- 7644 Lexington Manor Dr
- 2615 Thrush Grove
- 7636 Lexington Manor Dr
- 3329 Misty Meadows Dr
- 2507 Legend Terrace
- 3455 Sun River Place
- 7612 Clover Hill Dr
- 2650 Bannister Ct
- 3142 Soaring Bird Cir
- 7679 Safari Cir
- 3025 Zephyr Dr
- 7691 Safari Cir
- 3035 Zephyr Dr
- 7660 Rickshaw Dr
- 7673 Safari Cir
- 7650 Rickshaw Dr
- 7676 Safari Cir
- 3045 Zephyr Dr
- 7684 Safari Cir
- 7668 Safari Cir
- 7667 Safari Cir
- 7640 Rickshaw Dr
- 7660 Safari Cir
- 3020 Zephyr Dr
- 3030 Zephyr Dr
- 3010 Zephyr Dr
- 7630 Rickshaw Dr
- 7661 Safari Cir
- 2990 Zephyr Dr