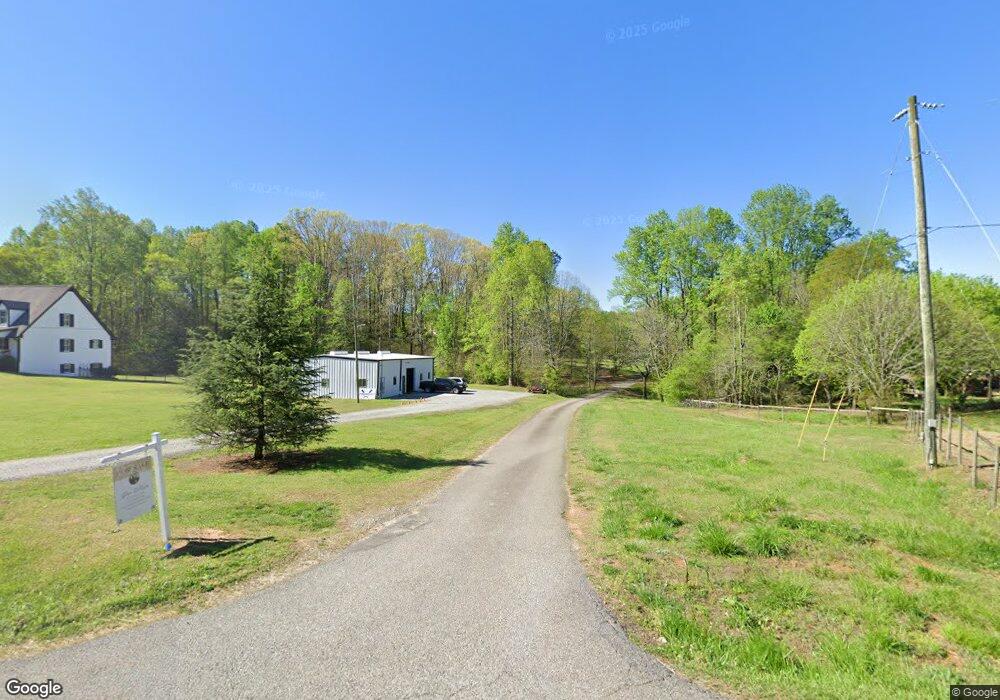
7686 A C Smith Rd Unit 228 Dawsonville, GA 30534
Estimated Value: $800,000 - $874,000
3
Beds
3
Baths
1,726
Sq Ft
$486/Sq Ft
Est. Value
About This Home
This home is located at 7686 A C Smith Rd Unit 228, Dawsonville, GA 30534 and is currently estimated at $838,707, approximately $485 per square foot. 7686 A C Smith Rd Unit 228 is a home located in Forsyth County with nearby schools including Silver City Elementary School, North Forsyth Middle School, and North Forsyth High School.
Ownership History
Date
Name
Owned For
Owner Type
Purchase Details
Closed on
Jun 28, 2024
Sold by
Estate Homes Llc
Bought by
Ragan Kelly and Ragan Drew
Current Estimated Value
Home Financials for this Owner
Home Financials are based on the most recent Mortgage that was taken out on this home.
Original Mortgage
$860,000
Outstanding Balance
$849,787
Interest Rate
7.02%
Mortgage Type
VA
Estimated Equity
-$11,080
Purchase Details
Closed on
Mar 24, 2021
Sold by
Shadburn Paul R
Bought by
Ragan Kelly and Ragan Drew
Home Financials for this Owner
Home Financials are based on the most recent Mortgage that was taken out on this home.
Original Mortgage
$495,000
Interest Rate
2.9%
Mortgage Type
VA
Create a Home Valuation Report for This Property
The Home Valuation Report is an in-depth analysis detailing your home's value as well as a comparison with similar homes in the area
Home Values in the Area
Average Home Value in this Area
Purchase History
| Date | Buyer | Sale Price | Title Company |
|---|---|---|---|
| Ragan Kelly | $653,900 | None Listed On Document | |
| Witzigman Patrick | $860,000 | None Listed On Document | |
| Ragan Kelly | $495,000 | -- |
Source: Public Records
Mortgage History
| Date | Status | Borrower | Loan Amount |
|---|---|---|---|
| Open | Witzigman Patrick | $860,000 | |
| Previous Owner | Ragan Kelly | $495,000 |
Source: Public Records
Tax History Compared to Growth
Tax History
| Year | Tax Paid | Tax Assessment Tax Assessment Total Assessment is a certain percentage of the fair market value that is determined by local assessors to be the total taxable value of land and additions on the property. | Land | Improvement |
|---|---|---|---|---|
| 2025 | $5,862 | $319,936 | $158,308 | $161,628 |
| 2024 | $5,862 | $289,792 | $132,432 | $157,360 |
| 2023 | $5,264 | $274,020 | $127,864 | $146,156 |
| 2022 | $4,715 | $108,808 | $29,128 | $79,680 |
| 2021 | $3,005 | $108,808 | $29,128 | $79,680 |
| 2020 | $2,907 | $105,288 | $29,128 | $76,160 |
| 2019 | $2,656 | $96,056 | $20,496 | $75,560 |
| 2018 | $2,330 | $84,256 | $20,496 | $63,760 |
| 2017 | $2,086 | $75,144 | $16,184 | $58,960 |
| 2016 | $1,996 | $71,904 | $12,944 | $58,960 |
| 2015 | $1,999 | $71,904 | $12,944 | $58,960 |
| 2014 | $1,769 | $66,824 | $0 | $0 |
Source: Public Records
Map
Nearby Homes
- 7580 Blacks Mill Rd
- 6405 Placid Way
- 5755 Hopewell Rd
- 4060 Jot Em Down Rd
- 4065 Jot Em Down Rd
- 4195 Settlers Grove Rd
- 7535 Rambling Vale
- 5830 Twelve Oaks Dr
- 7545 Rambling Vale
- 5720 Twelve Oaks Dr
- 7150 Ellorie Dr
- 4510 Trailmaster Cir
- Birch Plan at Ellorie Estates
- Hazel Plan at Ellorie Estates
- Sapling Plan at Ellorie Estates
- 6910 Ellorie Dr
- 4845 Plainsman Cir
- 6870 Ellorie Dr
- 7370 Quinn Ct
- 7470 Quinn Ct
- 7696 A C Smith Rd
- 7686 A C Smith Rd
- 7615 A C Smith Rd
- 7620 A C Smith Rd
- 7650 A C Smith Rd
- 7630 Silver Creek Rd
- 7630 Silver Creek Rd
- 7511 A C Smith Rd
- 000 Ac Smith Rd
- 5775 A C Smith Rd
- 7645 Silver Creek Rd
- 6595 A C Smith Rd
- 7470 A C Smith Rd
- 7655 Silver Creek Rd
- 7735 A C Smith Rd
- 7785 A C Smith Rd
- 7665 Silver Creek Rd
- 7768 A C Smith Rd
- 7545 Fireside Farm Dr
- 7525 Blacks Mill Rd