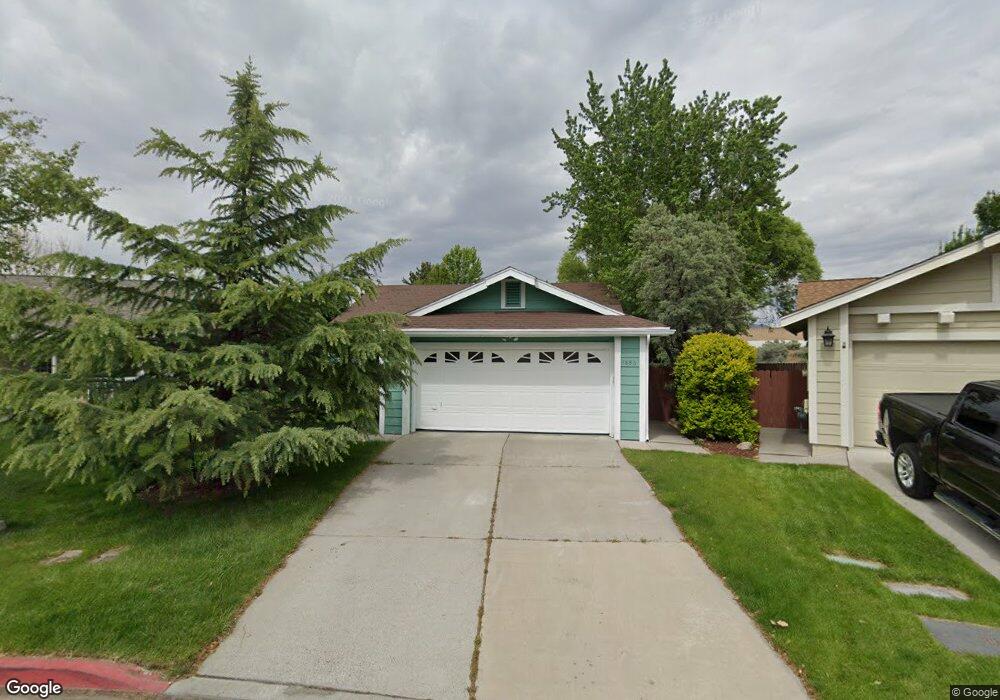
7686 Pickering Cir Unit 4 Reno, NV 89511
Bartley Ranch NeighborhoodEstimated Value: $471,000 - $520,000
3
Beds
2
Baths
1,288
Sq Ft
$386/Sq Ft
Est. Value
About This Home
This home is located at 7686 Pickering Cir Unit 4, Reno, NV 89511 and is currently estimated at $496,960, approximately $385 per square foot. 7686 Pickering Cir Unit 4 is a home located in Washoe County with nearby schools including Huffaker Elementary School, Edward L Pine Middle School, and Reno High School.
Ownership History
Date
Name
Owned For
Owner Type
Purchase Details
Closed on
May 29, 2002
Sold by
Maranon Jose A and Maranon Minerva M
Bought by
Elgendy Nadia
Current Estimated Value
Home Financials for this Owner
Home Financials are based on the most recent Mortgage that was taken out on this home.
Original Mortgage
$122,400
Outstanding Balance
$52,046
Interest Rate
6.89%
Estimated Equity
$444,914
Purchase Details
Closed on
Nov 25, 1996
Sold by
Mullen Michael P and Mullen Shannon
Bought by
Maranon Jose A and Maranon Minerva M
Home Financials for this Owner
Home Financials are based on the most recent Mortgage that was taken out on this home.
Original Mortgage
$134,612
Interest Rate
7.91%
Mortgage Type
FHA
Purchase Details
Closed on
Nov 11, 1993
Sold by
Dale Poe Development Corp
Bought by
Mullen Michael P and Mullen Shannon H
Home Financials for this Owner
Home Financials are based on the most recent Mortgage that was taken out on this home.
Original Mortgage
$97,350
Interest Rate
6.89%
Create a Home Valuation Report for This Property
The Home Valuation Report is an in-depth analysis detailing your home's value as well as a comparison with similar homes in the area
Home Values in the Area
Average Home Value in this Area
Purchase History
| Date | Buyer | Sale Price | Title Company |
|---|---|---|---|
| Elgendy Nadia | $153,000 | Founders Title Co | |
| Maranon Jose A | $137,000 | First Centennial Title Co | |
| Mullen Michael P | $104,000 | Comstock Title Company |
Source: Public Records
Mortgage History
| Date | Status | Borrower | Loan Amount |
|---|---|---|---|
| Open | Elgendy Nadia | $122,400 | |
| Previous Owner | Maranon Jose A | $134,612 | |
| Previous Owner | Mullen Michael P | $97,350 | |
| Closed | Elgendy Nadia | $15,300 |
Source: Public Records
Tax History Compared to Growth
Tax History
| Year | Tax Paid | Tax Assessment Tax Assessment Total Assessment is a certain percentage of the fair market value that is determined by local assessors to be the total taxable value of land and additions on the property. | Land | Improvement |
|---|---|---|---|---|
| 2025 | $1,947 | $79,544 | $36,855 | $42,689 |
| 2024 | $1,947 | $79,385 | $36,120 | $43,265 |
| 2023 | $1,892 | $76,849 | $35,700 | $41,149 |
| 2022 | $1,838 | $64,475 | $29,995 | $34,480 |
| 2021 | $1,784 | $58,164 | $23,625 | $34,539 |
| 2020 | $1,730 | $55,976 | $21,210 | $34,766 |
| 2019 | $1,681 | $54,289 | $20,545 | $33,744 |
| 2018 | $1,628 | $47,620 | $14,455 | $33,165 |
| 2017 | $1,584 | $47,810 | $14,455 | $33,355 |
| 2016 | $1,544 | $47,304 | $12,460 | $34,844 |
| 2015 | $1,512 | $44,830 | $10,780 | $34,050 |
| 2014 | $1,469 | $41,898 | $8,750 | $33,148 |
| 2013 | -- | $38,502 | $6,510 | $31,992 |
Source: Public Records
Map
Nearby Homes
- 7554 Whimbleton Way Unit 6
- 831 Blue Falls Place
- 7187 Blue Falls Cir
- 1145 Country Estates Cir
- 555 E Patriot Blvd Unit 276
- 555 E Patriot Blvd Unit M262
- 555 E Patriot Blvd Unit 218
- 555 E Patriot Blvd Unit 170
- 8620 Dixon Ln
- 8820 Dixon Ln
- 6421 Bonde Farms Ln
- 530 E Patriot Blvd Unit B114
- 450 Len Cir
- 8999 Panorama Dr
- 7274 Windmill Dr
- 84 Caballada St Unit 15-1
- 81 Caballada St
- 83 Caballada St Unit 14-1
- 1865 Olive Ln
- 66 Caballada St
- 7680 Pickering Cir
- 7692 Pickering Cir
- 7698 Pickering Cir
- 7674 Pickering Cir
- 7687 Pickering Cir Unit 4
- 7681 Pickering Cir
- 7704 Pickering Cir
- 7648 Water View Way
- 7675 Pickering Cir
- 7642 Water View Way
- 7710 Pickering Cir
- 7715 Pickering Cir Unit 4
- 7636 Water View Way
- 7716 Pickering Cir
- 7665 Water View Way
- 7661 Water View Way
- 7721 Pickering Cir
- 7630 Water View Way
- 7722 Pickering Cir
- 7674 Barnsdale Rd