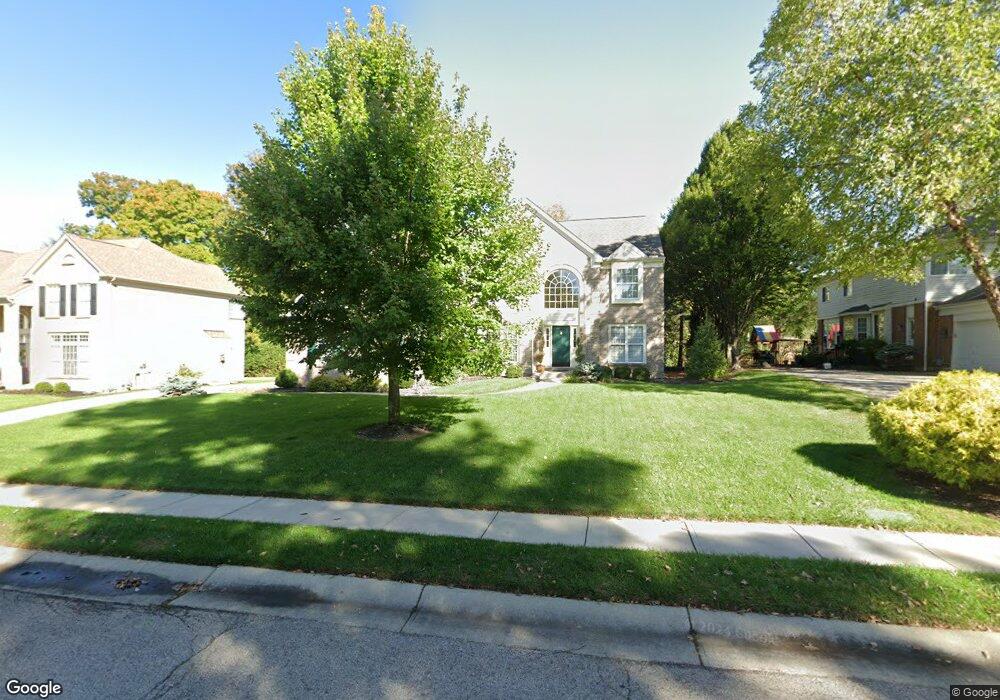
7686 Piney Meadow Ln Cincinnati, OH 45244
Dry Run NeighborhoodEstimated Value: $619,129 - $855,000
4
Beds
3
Baths
2,988
Sq Ft
$241/Sq Ft
Est. Value
About This Home
This home is located at 7686 Piney Meadow Ln, Cincinnati, OH 45244 and is currently estimated at $719,282, approximately $240 per square foot. 7686 Piney Meadow Ln is a home located in Hamilton County with nearby schools including Wilson Elementary School, Nagel Middle School, and Turpin High School.
Ownership History
Date
Name
Owned For
Owner Type
Purchase Details
Closed on
Nov 22, 2021
Sold by
Krausser Graham M and Wright Rebecca W
Bought by
Frisco Michael and Frisco Katherine
Current Estimated Value
Purchase Details
Closed on
Oct 4, 2000
Sold by
Fischer Single Family Homes Ltd
Bought by
Nunlist Roger J and Nunlist Mary A
Home Financials for this Owner
Home Financials are based on the most recent Mortgage that was taken out on this home.
Original Mortgage
$252,700
Interest Rate
7.99%
Create a Home Valuation Report for This Property
The Home Valuation Report is an in-depth analysis detailing your home's value as well as a comparison with similar homes in the area
Home Values in the Area
Average Home Value in this Area
Purchase History
| Date | Buyer | Sale Price | Title Company |
|---|---|---|---|
| Frisco Michael | $500,000 | Lawyers Title | |
| Nunlist Roger J | $398,800 | Homestead Title Agency Inc |
Source: Public Records
Mortgage History
| Date | Status | Borrower | Loan Amount |
|---|---|---|---|
| Previous Owner | Nunlist Roger J | $252,700 |
Source: Public Records
Tax History
| Year | Tax Paid | Tax Assessment Tax Assessment Total Assessment is a certain percentage of the fair market value that is determined by local assessors to be the total taxable value of land and additions on the property. | Land | Improvement |
|---|---|---|---|---|
| 2025 | $12,211 | $195,444 | $24,570 | $170,874 |
| 2024 | $11,867 | $195,444 | $24,570 | $170,874 |
| 2023 | $11,287 | $195,444 | $24,570 | $170,874 |
| 2022 | $10,299 | $158,802 | $27,685 | $131,117 |
| 2021 | $10,056 | $158,802 | $27,685 | $131,117 |
| 2020 | $10,171 | $158,802 | $27,685 | $131,117 |
| 2019 | $9,914 | $140,532 | $24,500 | $116,032 |
| 2018 | $9,286 | $140,532 | $24,500 | $116,032 |
| 2017 | $8,757 | $140,532 | $24,500 | $116,032 |
| 2016 | $9,538 | $149,576 | $27,195 | $122,381 |
| 2015 | $9,264 | $149,576 | $27,195 | $122,381 |
| 2014 | $9,270 | $149,576 | $27,195 | $122,381 |
| 2013 | $7,898 | $134,754 | $24,500 | $110,254 |
Source: Public Records
Map
Nearby Homes
- 2105 Clough Chase Dr
- 2274 Pointe Place
- 2121 Clough Chase Dr
- 7712 Stonehill Dr
- 1858 Foxhollow Dr
- 1786 Woodpine Ln
- 2106 Forestlake Dr
- 7660 Clough Pike
- 7652 Clough Pike
- 7392 Hunley Rd
- 7481 Heatherwood Ln
- 8146 Clough Pike
- 8069 Ashgrove Dr
- 1750 Emerald Glade Ln
- 2559 Concordgreen Dr
- 7967 Kimbee Dr
- 7968 State Rd
- 7080 Hunley Rd
- 1847 Eight Mile Rd
- 8022 Stonegate Dr
- 7678 Piney Meadow Ln
- 2145 Bruns Ln
- 7670 Piney Meadow Ln
- 7681 Athenia Dr
- 7689 Athenia Dr
- 7673 Athenia Dr
- 2115 Bruns Ln
- 7697 Athenia Dr
- 7665 Athenia Dr
- 3 Bruns Ln Unit 3
- 2 Bruns Ln Unit 2
- 7662 Piney Meadow Ln
- 2140 Bruns Ln
- 2150 Bruns Ln
- 7669 Piney Meadow Ln
- 2130 Bruns Ln
- 7657 Athenia Dr
- 2120 Bruns Ln
- 7661 Piney Meadow Ln
- 7650 Piney Meadow Ln
Your Personal Tour Guide
Ask me questions while you tour the home.