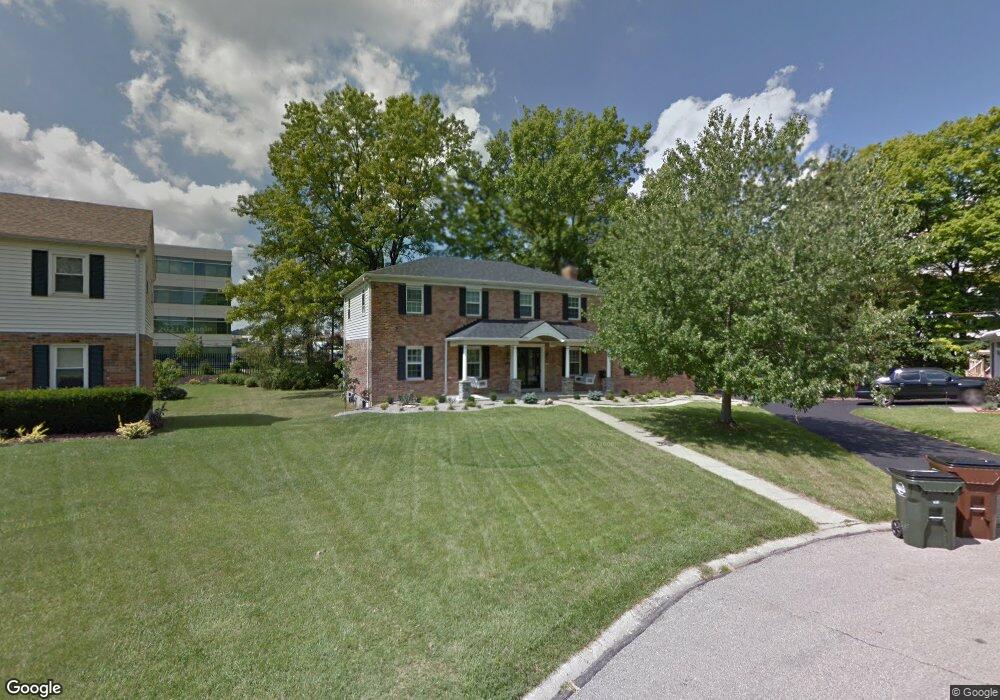
7687 Ginnala Ct Cincinnati, OH 45243
Estimated Value: $592,000 - $775,000
4
Beds
4
Baths
2,706
Sq Ft
$241/Sq Ft
Est. Value
About This Home
This home is located at 7687 Ginnala Ct, Cincinnati, OH 45243 and is currently estimated at $651,450, approximately $240 per square foot. 7687 Ginnala Ct is a home located in Hamilton County with nearby schools including Indian Hill Primary School, Indian Hill Elementary School, and Indian Hill Middle School.
Ownership History
Date
Name
Owned For
Owner Type
Purchase Details
Closed on
Sep 12, 2016
Sold by
Harris Dan and Harris Linda
Bought by
Chamot Jeffrey A
Current Estimated Value
Home Financials for this Owner
Home Financials are based on the most recent Mortgage that was taken out on this home.
Original Mortgage
$265,000
Outstanding Balance
$211,672
Interest Rate
3.43%
Mortgage Type
New Conventional
Estimated Equity
$439,778
Purchase Details
Closed on
Jul 18, 2011
Sold by
Kenwood Towers Llc
Bought by
Chamot Jeffrey A and Chamot Paula
Home Financials for this Owner
Home Financials are based on the most recent Mortgage that was taken out on this home.
Original Mortgage
$22,500
Interest Rate
4.52%
Mortgage Type
Credit Line Revolving
Purchase Details
Closed on
Oct 13, 2010
Sold by
Meyer Gloria E and Meyer Larry E
Bought by
Kenwood Towers Llc
Purchase Details
Closed on
Apr 15, 2003
Sold by
Meyer Larry E and Meyer Gloria E
Bought by
Meyer Gloria E and Meyer Larry E
Create a Home Valuation Report for This Property
The Home Valuation Report is an in-depth analysis detailing your home's value as well as a comparison with similar homes in the area
Home Values in the Area
Average Home Value in this Area
Purchase History
| Date | Buyer | Sale Price | Title Company |
|---|---|---|---|
| Chamot Jeffrey A | $263,200 | -- | |
| Chamot Jeffrey A | -- | -- | |
| Kenwood Towers Llc | -- | Attorney | |
| Meyer Gloria E | -- | -- |
Source: Public Records
Mortgage History
| Date | Status | Borrower | Loan Amount |
|---|---|---|---|
| Open | Chamot Jeffrey A | $265,000 | |
| Previous Owner | Chamot Jeffrey A | $22,500 |
Source: Public Records
Tax History Compared to Growth
Tax History
| Year | Tax Paid | Tax Assessment Tax Assessment Total Assessment is a certain percentage of the fair market value that is determined by local assessors to be the total taxable value of land and additions on the property. | Land | Improvement |
|---|---|---|---|---|
| 2024 | $6,118 | $156,622 | $29,575 | $127,047 |
| 2023 | $6,154 | $156,622 | $29,575 | $127,047 |
| 2022 | $5,778 | $123,526 | $20,269 | $103,257 |
| 2021 | $5,154 | $123,526 | $20,269 | $103,257 |
| 2020 | $5,154 | $123,526 | $20,269 | $103,257 |
| 2019 | $4,848 | $108,357 | $17,780 | $90,577 |
| 2018 | $4,859 | $108,357 | $17,780 | $90,577 |
| 2017 | $4,633 | $108,357 | $17,780 | $90,577 |
| 2016 | $3,615 | $83,738 | $16,170 | $67,568 |
| 2015 | $3,641 | $83,738 | $16,170 | $67,568 |
| 2014 | $3,558 | $82,688 | $16,170 | $66,518 |
| 2013 | $3,512 | $78,750 | $15,400 | $63,350 |
Source: Public Records
Map
Nearby Homes
- 7300 N Mingo Ln
- 6951 Miami Hills Dr
- 6640 Kugler Mill Rd
- 7266 E Galbraith Rd
- 7268 E Galbraith Rd
- 7809 Locust Ln
- 7747 Kugler Mill Rd
- 6947 Euclid Ave
- 7811 Locust Ln
- 7251 Miami Ave
- 7471 Mar Del Dr
- 7317 Euclid Ave
- 7821 Greenbriar Ln
- 6849 Springcrest Cir
- 7156 Maple Ave
- 7112 Summit Ave
- 7800 Spirea Dr
- 5760 Kugler Mill Rd
- 7108 Fowler Ave
- 4576 Orchard Ln
- 7699 Ginnala Ct
- 7679 Ginnala Ct
- 7696 Ginnala Ct
- 7667 Ginnala Ct
- 7684 Ginnala Ct
- 7674 Ginnala Ct
- 7657 Ginnala Ct
- 7662 Ginnala Ct
- 7797 Hosbrook Rd
- 7645 Ginnala Ct
- 7652 Ginnala Ct
- 7731 Hosbrook Rd
- 7751 Hosbrook Rd
- 7711 Hosbrook Rd
- 7691 Hosbrook Rd
- 7640 Ginnala Ct
- 7635 Ginnala Ct
- 7671 Hosbrook Rd
- 7630 Ginnala Ct
- 7651 Hosbrook Rd