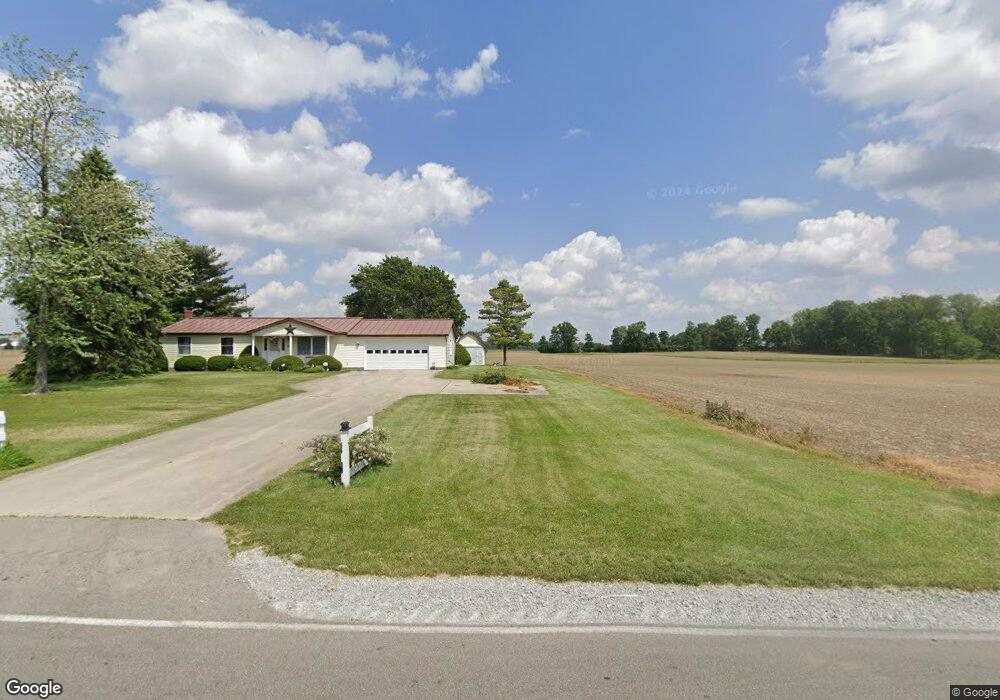
7687 N Alcony Conover Rd Conover, OH 45317
Estimated Value: $185,900 - $239,000
3
Beds
2
Baths
1,480
Sq Ft
$144/Sq Ft
Est. Value
About This Home
This home is located at 7687 N Alcony Conover Rd, Conover, OH 45317 and is currently estimated at $213,725, approximately $144 per square foot. 7687 N Alcony Conover Rd is a home located in Miami County with nearby schools including Miami East Elementary School, Miami East Junior High School, and Miami East High School.
Ownership History
Date
Name
Owned For
Owner Type
Purchase Details
Closed on
Dec 28, 2012
Sold by
Wisler Denton S and Wisler Tonya L
Bought by
Nation Christopher M and Nation Okeyshia K
Current Estimated Value
Home Financials for this Owner
Home Financials are based on the most recent Mortgage that was taken out on this home.
Original Mortgage
$109,846
Outstanding Balance
$76,162
Interest Rate
3.31%
Mortgage Type
New Conventional
Estimated Equity
$137,563
Purchase Details
Closed on
Mar 30, 2009
Sold by
Routson Karen A and Warner Karen A
Bought by
Wisler Denton S and Wisler Tonya L
Purchase Details
Closed on
Sep 26, 1991
Bought by
Routson Karen A
Create a Home Valuation Report for This Property
The Home Valuation Report is an in-depth analysis detailing your home's value as well as a comparison with similar homes in the area
Home Values in the Area
Average Home Value in this Area
Purchase History
| Date | Buyer | Sale Price | Title Company |
|---|---|---|---|
| Nation Christopher M | $107,700 | Attorney | |
| Wisler Denton S | $95,000 | -- | |
| Routson Karen A | -- | -- |
Source: Public Records
Mortgage History
| Date | Status | Borrower | Loan Amount |
|---|---|---|---|
| Open | Nation Christopher M | $109,846 |
Source: Public Records
Tax History Compared to Growth
Tax History
| Year | Tax Paid | Tax Assessment Tax Assessment Total Assessment is a certain percentage of the fair market value that is determined by local assessors to be the total taxable value of land and additions on the property. | Land | Improvement |
|---|---|---|---|---|
| 2024 | $1,312 | $36,930 | $1,860 | $35,070 |
| 2023 | $1,312 | $36,930 | $1,860 | $35,070 |
| 2022 | $1,348 | $36,930 | $1,860 | $35,070 |
| 2021 | $1,198 | $30,770 | $1,540 | $29,230 |
| 2020 | $1,204 | $30,770 | $1,540 | $29,230 |
| 2019 | $1,222 | $30,770 | $1,540 | $29,230 |
| 2018 | $1,330 | $32,730 | $1,580 | $31,150 |
| 2017 | $1,304 | $32,730 | $1,580 | $31,150 |
| 2016 | $1,227 | $32,730 | $1,580 | $31,150 |
| 2015 | $1,211 | $30,310 | $1,470 | $28,840 |
| 2014 | $1,211 | $30,310 | $1,470 | $28,840 |
| 2013 | $1,163 | $30,310 | $1,470 | $28,840 |
Source: Public Records
Map
Nearby Homes
- 7210 N Bollinger Rd
- 108 E 2nd St
- 106 E 1st St
- 0 3rd St
- 6380 State Route 589
- 148 Dorsey Hageman Rd
- 111 Rupolo Dr
- 115 S High St
- 218 W Troy St
- 203 W Main St
- 211 Dugan St
- 133 Dugan St
- 101 Maple Dr
- 4845 E Troy Urbana Rd
- 126 Bowersock Ave
- 10568 N Casstown Sidney Rd
- 309 N Grant St
- 213 N Main St
- 2920 Hoying Dr
- 2912 Hoying Dr
- 7677 N Alcony Conover Rd
- 7651 N Alcony Conover Rd
- 7690 N Alcony Conover Rd
- 7670 N Alcony Conover Rd
- 7660 N Alcony Conover Rd
- 7650 N Alcony Conover Rd
- 7720 N Alcony Conover Rd
- 7740 N Alcony Conover Rd
- 7605 N Alcony Conover Rd
- 7605 Alcony- Conover Rd
- 8661 E Conover Rd
- 7610 N Alcony Conover Rd
- 7760 N Alcony Conover Rd
- 0 Alcony- Conover Rd
- 7595 N Alcony Conover Rd
- 7600 N Alcony Conover Rd
- 7600 Alcony Conov
- 7787 N Alcony Conover Rd
- 7590 N Alcony Conover Rd
- 7595 Franklin St