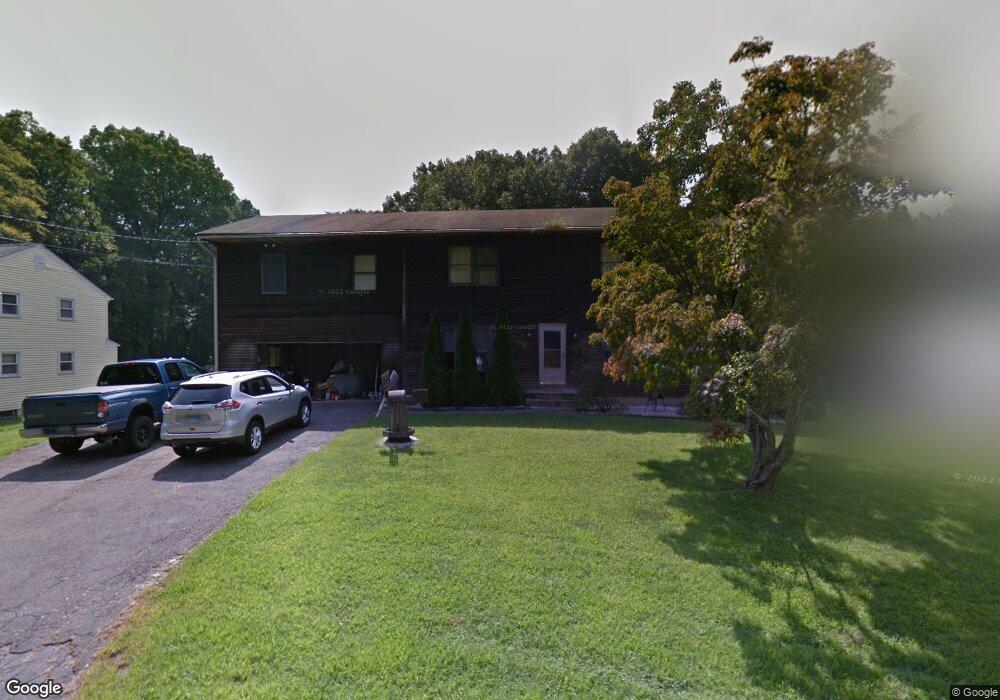
769 Burnham St East Hartford, CT 06108
Estimated Value: $387,000 - $434,585
5
Beds
3
Baths
2,684
Sq Ft
$154/Sq Ft
Est. Value
About This Home
This home is located at 769 Burnham St, East Hartford, CT 06108 and is currently estimated at $412,396, approximately $153 per square foot. 769 Burnham St is a home located in Hartford County with nearby schools including Dr. John A. Langford School, East Hartford Middle School, and East Hartford High School.
Ownership History
Date
Name
Owned For
Owner Type
Purchase Details
Closed on
Jul 25, 2019
Sold by
Bushey Frederick A
Bought by
Martinez Victor and Martinez Maria
Current Estimated Value
Home Financials for this Owner
Home Financials are based on the most recent Mortgage that was taken out on this home.
Original Mortgage
$148,500
Outstanding Balance
$130,099
Interest Rate
3.82%
Mortgage Type
Purchase Money Mortgage
Estimated Equity
$282,297
Purchase Details
Closed on
Jun 22, 1989
Sold by
Bushey Frances M
Bought by
Bushey Frederick A
Create a Home Valuation Report for This Property
The Home Valuation Report is an in-depth analysis detailing your home's value as well as a comparison with similar homes in the area
Home Values in the Area
Average Home Value in this Area
Purchase History
| Date | Buyer | Sale Price | Title Company |
|---|---|---|---|
| Martinez Victor | $165,000 | -- | |
| Bushey Frederick A | $135,000 | -- |
Source: Public Records
Mortgage History
| Date | Status | Borrower | Loan Amount |
|---|---|---|---|
| Open | Martinez Victor | $148,500 | |
| Previous Owner | Bushey Frederick A | $110,000 | |
| Previous Owner | Bushey Frederick A | $100,000 | |
| Previous Owner | Bushey Frederick A | $125,800 |
Source: Public Records
Tax History Compared to Growth
Tax History
| Year | Tax Paid | Tax Assessment Tax Assessment Total Assessment is a certain percentage of the fair market value that is determined by local assessors to be the total taxable value of land and additions on the property. | Land | Improvement |
|---|---|---|---|---|
| 2025 | $7,999 | $174,270 | $37,090 | $137,180 |
| 2024 | $7,668 | $174,270 | $37,090 | $137,180 |
| 2023 | $7,413 | $174,270 | $37,090 | $137,180 |
| 2022 | $7,145 | $174,270 | $37,090 | $137,180 |
| 2021 | $6,974 | $141,310 | $31,220 | $110,090 |
| 2020 | $7,054 | $141,310 | $31,220 | $110,090 |
| 2019 | $6,940 | $141,310 | $31,220 | $110,090 |
| 2018 | $6,735 | $141,310 | $31,220 | $110,090 |
| 2017 | $6,649 | $141,310 | $31,220 | $110,090 |
| 2016 | $6,712 | $146,350 | $31,220 | $115,130 |
| 2015 | $6,712 | $146,350 | $31,220 | $115,130 |
| 2014 | $6,644 | $146,350 | $31,220 | $115,130 |
Source: Public Records
Map
Nearby Homes
- 737 Burnham St
- 263 Lefoll Blvd
- 643 Burnham St W
- 7 Colgate Ln
- 12 Depauw Cir
- 61 Leverich Dr
- 913 Pleasant Valley Rd
- 949 Pleasant Valley Rd
- 962 Pleasant Valley Rd
- 25 Amato Dr Unit H
- 952 Tolland St
- 1555 Tolland Turnpike
- 7 Cinnamon Springs Unit 7
- 50 Parkview Dr
- 11 Saint Marc Cir O Cir
- 1 Saint Marc Cir Unit A
- 5 Saint Marc Cir Unit H
- 47 Bodwell Rd
- 25 Stonehaven Cir
- 0 Hillside Ave