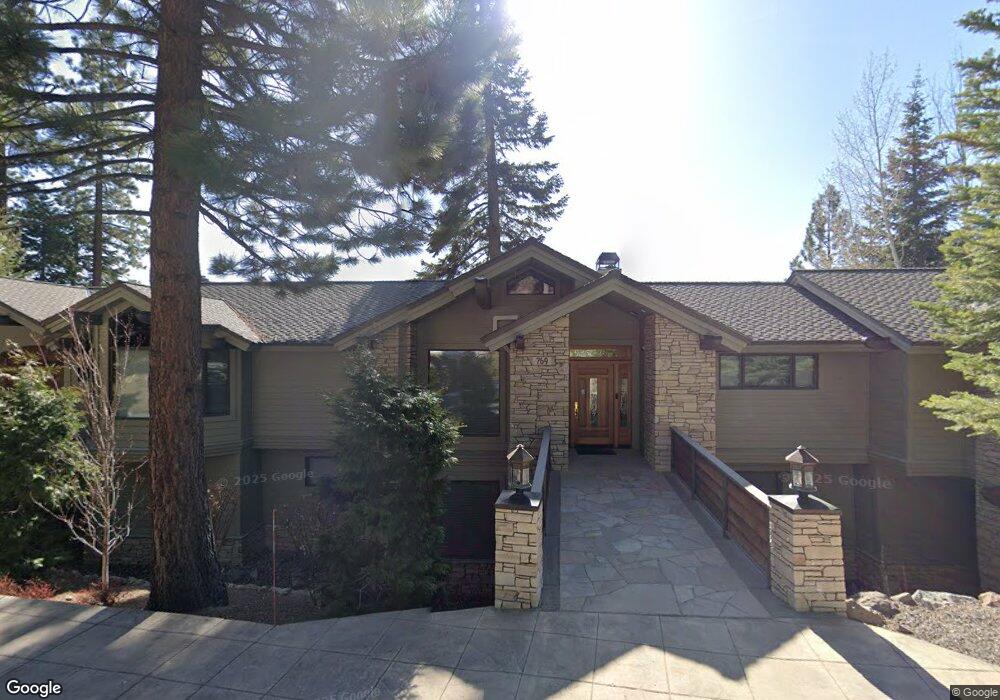
769 Champagne Rd Incline Village, NV 89451
Estimated Value: $1,783,000 - $8,430,000
5
Beds
8
Baths
7,614
Sq Ft
$775/Sq Ft
Est. Value
About This Home
This home is located at 769 Champagne Rd, Incline Village, NV 89451 and is currently estimated at $5,903,108, approximately $775 per square foot. 769 Champagne Rd is a home located in Washoe County with nearby schools including Incline Elementary School, Incline Middle School, and Incline High School.
Ownership History
Date
Name
Owned For
Owner Type
Purchase Details
Closed on
Sep 21, 1998
Sold by
Franking Neal A and Franking Vanessa W
Bought by
Franking Neal A and Franking Vanessa W
Current Estimated Value
Purchase Details
Closed on
Jul 18, 1997
Sold by
Deeter John H
Bought by
Franking Neal A and Franking Vanessa W
Home Financials for this Owner
Home Financials are based on the most recent Mortgage that was taken out on this home.
Original Mortgage
$3,300,000
Interest Rate
7.25%
Purchase Details
Closed on
Mar 22, 1994
Sold by
Frank John Howard and Frank Liliana Marie
Bought by
Deeter John H
Purchase Details
Closed on
Dec 28, 1993
Sold by
Luni Eugene W and Luni Louise R
Bought by
Frank John Howard and Frank Liliana Marie
Create a Home Valuation Report for This Property
The Home Valuation Report is an in-depth analysis detailing your home's value as well as a comparison with similar homes in the area
Home Values in the Area
Average Home Value in this Area
Purchase History
| Date | Buyer | Sale Price | Title Company |
|---|---|---|---|
| Franking Neal A | -- | -- | |
| Franking Neal A | $3,300,000 | First American Title Co | |
| Deeter John H | $550,000 | First Centennial Title Co | |
| Frank John Howard | $425,000 | First Centennial Title Co |
Source: Public Records
Mortgage History
| Date | Status | Borrower | Loan Amount |
|---|---|---|---|
| Closed | Franking Neal A | $3,300,000 |
Source: Public Records
Tax History Compared to Growth
Tax History
| Year | Tax Paid | Tax Assessment Tax Assessment Total Assessment is a certain percentage of the fair market value that is determined by local assessors to be the total taxable value of land and additions on the property. | Land | Improvement |
|---|---|---|---|---|
| 2025 | $47,700 | $1,634,481 | $535,500 | $1,098,981 |
| 2024 | $47,700 | $1,609,147 | $505,750 | $1,103,397 |
| 2023 | $46,330 | $1,494,404 | $446,250 | $1,048,154 |
| 2022 | $45,319 | $1,319,226 | $386,750 | $932,476 |
| 2021 | $44,022 | $1,245,789 | $327,250 | $918,539 |
| 2020 | $42,810 | $1,206,571 | $297,500 | $909,071 |
| 2019 | $43,492 | $1,234,419 | $297,500 | $936,919 |
| 2018 | $43,103 | $1,224,706 | $267,750 | $956,956 |
| 2017 | $42,139 | $1,208,855 | $252,875 | $955,980 |
| 2016 | $41,092 | $1,187,885 | $220,150 | $967,735 |
| 2015 | $41,011 | $1,192,676 | $220,150 | $972,526 |
| 2014 | $39,841 | $1,132,390 | $220,150 | $912,240 |
| 2013 | -- | $1,160,073 | $220,150 | $939,923 |
Source: Public Records
Map
Nearby Homes
- 757 Champagne Rd
- 949 Fairview Blvd
- 714 Champagne Rd
- 790 Fairview Blvd
- 725 Fairview Blvd Unit 11
- 725 Fairview Blvd Unit 40
- 708 Champagne Rd
- 949 Dana Ct Unit 14
- 696 Village Blvd Unit 24
- 696 Village Blvd Unit 12
- 696 Village Blvd Unit 20
- 711 Birdie Way
- 770 Golfers Pass Rd
- 654 Country Club Dr
- 987 Wander Way
- 978 Glenrock Dr Unit 45
- 978 Glenrock Dr Unit 13
- 898 Peepsight Cir Unit 27B
- 949 Jennifer St
- 917 Jennifer St
- 775 Champagne Rd
- 726 Champagne Rd
- 743 Burgundy Rd
- 739 Burgundy Rd
- 755 Burgundy Ln
- 755 Burgundy Ln Unit 3
- 755 Burgundy Rd
- 915 Fairview Blvd
- 751 Champagne Rd
- 786 Burgundy Rd
- 745 Champagne Rd
- 759 Burgundy Rd
- 720 Champagne Rd
- 739 Champagne Rd
- 929 Fairview Blvd
- 772 Fairview Blvd
- 733 Champagne Rd
- 771 Burgundy Rd
- 723 Burgundy Rd
- 727 Champagne Rd