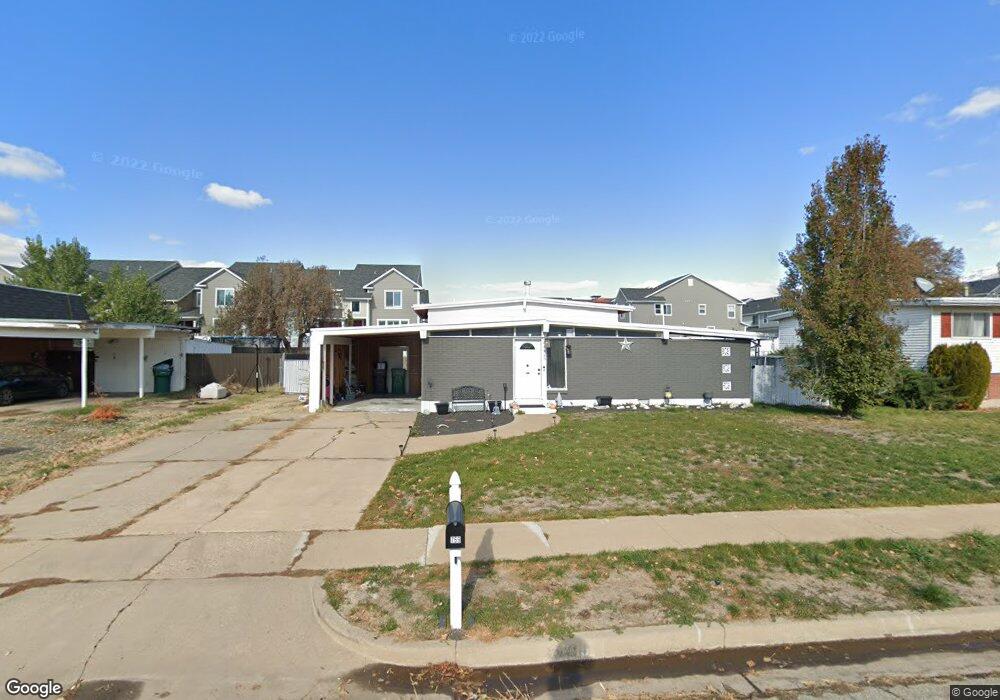
769 E 900 N Layton, UT 84041
Estimated Value: $398,000 - $418,301
3
Beds
2
Baths
1,664
Sq Ft
$248/Sq Ft
Est. Value
About This Home
This home is located at 769 E 900 N, Layton, UT 84041 and is currently estimated at $412,075, approximately $247 per square foot. 769 E 900 N is a home located in Davis County with nearby schools including King Elementary School, Central Davis Junior High School, and Layton High School.
Ownership History
Date
Name
Owned For
Owner Type
Purchase Details
Closed on
Nov 7, 2018
Sold by
Mendias Dimitri A and Hendrick Shareeka
Bought by
Centner Justin
Current Estimated Value
Home Financials for this Owner
Home Financials are based on the most recent Mortgage that was taken out on this home.
Original Mortgage
$207,178
Outstanding Balance
$183,028
Interest Rate
5.13%
Mortgage Type
FHA
Estimated Equity
$229,047
Purchase Details
Closed on
May 13, 2010
Sold by
Hendrickson Tamara Lee and Johansen Laurel Ann
Bought by
Peterson Johnathan and Peterson Kathleen
Home Financials for this Owner
Home Financials are based on the most recent Mortgage that was taken out on this home.
Original Mortgage
$117,350
Interest Rate
5.04%
Mortgage Type
New Conventional
Purchase Details
Closed on
Feb 13, 1995
Sold by
Rudd Anna Mae and Bright Anna Mae
Bought by
Rudd Anna Mae Weeks Bright
Create a Home Valuation Report for This Property
The Home Valuation Report is an in-depth analysis detailing your home's value as well as a comparison with similar homes in the area
Home Values in the Area
Average Home Value in this Area
Purchase History
| Date | Buyer | Sale Price | Title Company |
|---|---|---|---|
| Centner Justin | -- | North American Title | |
| Peterson Johnathan | -- | Backman Title Services | |
| Peterson Johnathan | -- | Backman Title Services | |
| Rudd Anna Mae Weeks Bright | -- | -- |
Source: Public Records
Mortgage History
| Date | Status | Borrower | Loan Amount |
|---|---|---|---|
| Open | Centner Justin | $207,178 | |
| Previous Owner | Peterson Johnathan | $117,350 |
Source: Public Records
Tax History
| Year | Tax Paid | Tax Assessment Tax Assessment Total Assessment is a certain percentage of the fair market value that is determined by local assessors to be the total taxable value of land and additions on the property. | Land | Improvement |
|---|---|---|---|---|
| 2025 | $1,928 | $202,400 | $100,178 | $102,222 |
| 2024 | $1,852 | $195,801 | $116,837 | $78,964 |
| 2023 | $1,744 | $325,000 | $139,920 | $185,080 |
| 2022 | $1,804 | $182,600 | $73,674 | $108,926 |
| 2021 | $1,610 | $243,000 | $102,544 | $140,456 |
| 2020 | $1,443 | $209,000 | $86,619 | $122,381 |
| 2019 | $1,424 | $202,000 | $82,576 | $119,424 |
| 2018 | $1,271 | $181,000 | $82,576 | $98,424 |
| 2016 | $1,102 | $80,961 | $26,164 | $54,797 |
| 2015 | $1,036 | $72,270 | $26,501 | $45,769 |
| 2014 | $1,081 | $77,095 | $26,501 | $50,594 |
| 2013 | -- | $78,054 | $18,612 | $59,442 |
Source: Public Records
Map
Nearby Homes
- 806 Valeria Dr
- 540 E Quail Ln N
- 997 E 825 N
- 800 Kirk St
- 618 Valeria Dr
- 857 E 575 N
- 861 E 575 N
- 556 N Fairfield Rd Unit A2
- 556 N Fairfield Rd Unit D1
- 556 N Fairfield Rd Unit D2
- 556 N Fairfield Rd Unit A3
- 556 N Fairfield Rd Unit D3
- 556 N Fairfield Rd Unit D4
- 556 N Fairfield Rd Unit A1
- 556 N Fairfield Rd Unit A4
- 508 N Adamswood Rd
- 965 Amethyst St
- 1048 E Cherry Ln
- 431 N 1050 E
- 324 E 1325 N
- 785 E 900 N
- 753 E 900 N
- 753 Aspen East Dr
- 774 E 950 N Unit 207
- 768 E 950 N
- 801 Aspen East Dr
- 801 E 775 N
- 739 Aspen East Dr
- 762 E 950 N Unit 210
- 739 E 900 N
- 935 N 800 E Unit 213
- 758 E 950 N
- 782 E 900 N
- 766 E 900 N
- 939 N 800 E Unit 214
- 754 E 950 N
- 750 Aspen East Dr
- 943 N 800 E Unit 215
- 798 E 900 N
- 750 E 900 N