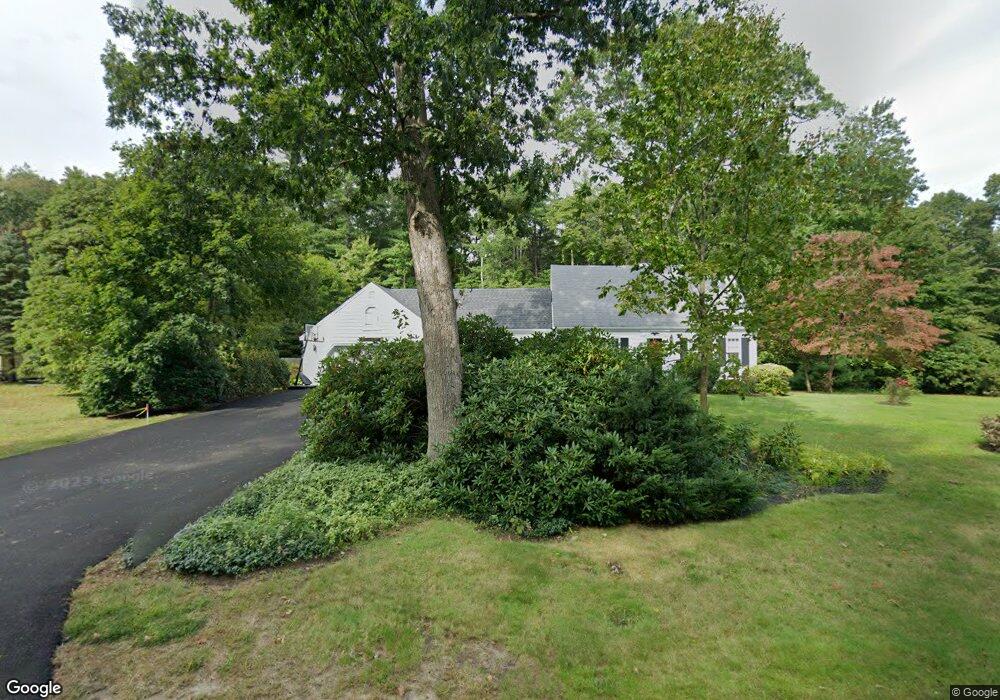
769 High St Hanson, MA 02341
Estimated Value: $495,000 - $624,000
3
Beds
2
Baths
1,564
Sq Ft
$373/Sq Ft
Est. Value
About This Home
This home is located at 769 High St, Hanson, MA 02341 and is currently estimated at $583,802, approximately $373 per square foot. 769 High St is a home located in Plymouth County.
Ownership History
Date
Name
Owned For
Owner Type
Purchase Details
Closed on
Mar 29, 2016
Sold by
Hammond Jeffrey
Bought by
Hammond Jeffrey R and Hammond Nora A
Current Estimated Value
Purchase Details
Closed on
Jul 14, 2009
Sold by
Hammond Mark W
Bought by
Hammond Jeffrey R
Purchase Details
Closed on
Apr 14, 2008
Sold by
Hammond Donald E
Bought by
Hammond Jeffrey
Purchase Details
Closed on
Apr 7, 2008
Sold by
Long Elise C
Bought by
Hammond Jeffrey
Create a Home Valuation Report for This Property
The Home Valuation Report is an in-depth analysis detailing your home's value as well as a comparison with similar homes in the area
Home Values in the Area
Average Home Value in this Area
Purchase History
| Date | Buyer | Sale Price | Title Company |
|---|---|---|---|
| Hammond Jeffrey R | -- | -- | |
| Hammond Jeffrey R | $1,000 | -- | |
| Hammond Jeffrey | $1,000 | -- | |
| Hammond Jeffrey | $80,000 | -- |
Source: Public Records
Mortgage History
| Date | Status | Borrower | Loan Amount |
|---|---|---|---|
| Previous Owner | Hammond Jeffrey | $50,000 |
Source: Public Records
Tax History
| Year | Tax Paid | Tax Assessment Tax Assessment Total Assessment is a certain percentage of the fair market value that is determined by local assessors to be the total taxable value of land and additions on the property. | Land | Improvement |
|---|---|---|---|---|
| 2025 | $7,049 | $526,800 | $189,200 | $337,600 |
| 2024 | $6,845 | $511,600 | $183,700 | $327,900 |
| 2023 | $6,555 | $462,300 | $183,700 | $278,600 |
| 2022 | $6,345 | $420,500 | $167,000 | $253,500 |
| 2021 | $5,631 | $372,900 | $160,600 | $212,300 |
| 2020 | $5,503 | $360,400 | $155,100 | $205,300 |
| 2019 | $5,274 | $339,600 | $152,200 | $187,400 |
| 2018 | $5,175 | $326,900 | $146,400 | $180,500 |
| 2017 | $4,979 | $311,600 | $139,400 | $172,200 |
| 2016 | $4,538 | $274,200 | $139,400 | $134,800 |
| 2015 | $4,324 | $271,600 | $139,400 | $132,200 |
Source: Public Records
Map
Nearby Homes
- Lot 6 Way
- 84 Liberty St
- 26 Stonebridge Dr
- Lot 5 Princeton Way
- 80 Phillips St
- 72 Phillips St
- 134 Crescent St
- 168 Spring St
- 353 Cross St
- 1139 Main St Unit 4
- 1054 Main St
- 269 Lakeside Rd
- 430 Brook Bend Rd
- 842 Whitman St
- 23 Live Oak Way
- 26 Franklin St
- 126-130 Franklin St
- 22 Howland Trail Unit 34
- 108 Waterford Dr
- 7 Hayford Trail Unit 12