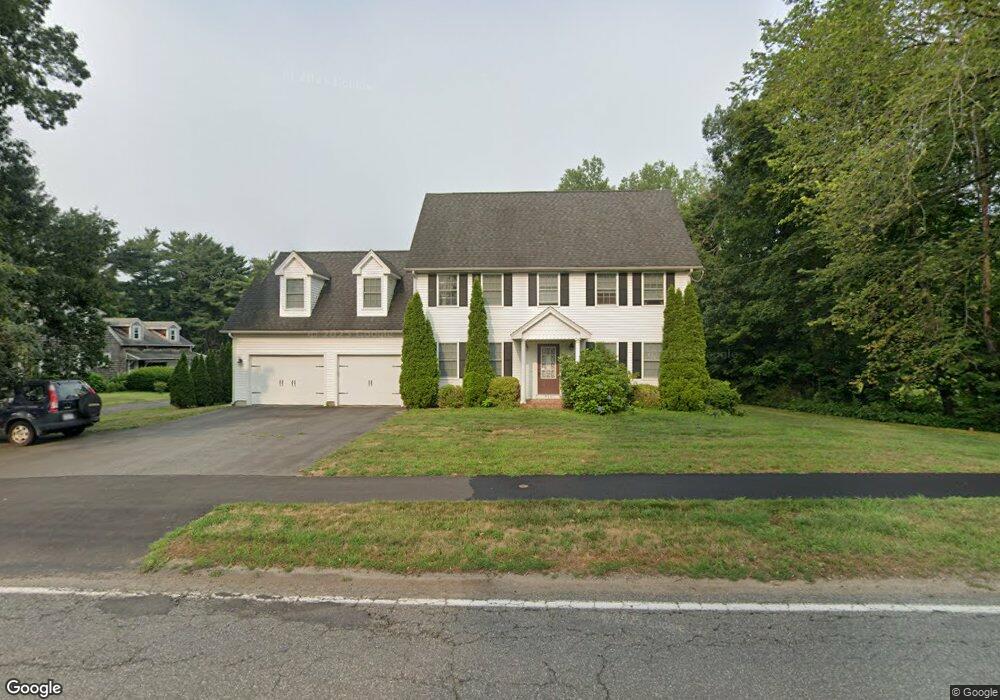
769 Main St Wilbraham, MA 01095
Estimated Value: $478,190 - $604,000
3
Beds
3
Baths
2,200
Sq Ft
$242/Sq Ft
Est. Value
About This Home
This home is located at 769 Main St, Wilbraham, MA 01095 and is currently estimated at $532,548, approximately $242 per square foot. 769 Main St is a home located in Hampden County with nearby schools including Minnechaug Regional High School and Wilbraham & Monson Academy.
Ownership History
Date
Name
Owned For
Owner Type
Purchase Details
Closed on
Oct 26, 2007
Sold by
Siciliano Michael A and Siciliano Michelle S
Bought by
Chen Zhide and Luo Mei Lan
Current Estimated Value
Home Financials for this Owner
Home Financials are based on the most recent Mortgage that was taken out on this home.
Original Mortgage
$278,400
Outstanding Balance
$176,237
Interest Rate
6.39%
Mortgage Type
Purchase Money Mortgage
Estimated Equity
$356,311
Purchase Details
Closed on
Oct 13, 2006
Sold by
Grandchamp Margaret A
Bought by
Siciliano Michael A and Siciliano Michelle S
Home Financials for this Owner
Home Financials are based on the most recent Mortgage that was taken out on this home.
Original Mortgage
$300,000
Interest Rate
6.47%
Mortgage Type
Purchase Money Mortgage
Create a Home Valuation Report for This Property
The Home Valuation Report is an in-depth analysis detailing your home's value as well as a comparison with similar homes in the area
Home Values in the Area
Average Home Value in this Area
Purchase History
| Date | Buyer | Sale Price | Title Company |
|---|---|---|---|
| Chen Zhide | $348,000 | -- | |
| Siciliano Michael A | $115,000 | -- |
Source: Public Records
Mortgage History
| Date | Status | Borrower | Loan Amount |
|---|---|---|---|
| Open | Chen Zhide | $278,400 | |
| Previous Owner | Siciliano Michael A | $300,000 |
Source: Public Records
Tax History Compared to Growth
Tax History
| Year | Tax Paid | Tax Assessment Tax Assessment Total Assessment is a certain percentage of the fair market value that is determined by local assessors to be the total taxable value of land and additions on the property. | Land | Improvement |
|---|---|---|---|---|
| 2025 | $7,583 | $424,100 | $81,700 | $342,400 |
| 2024 | $7,572 | $409,300 | $81,700 | $327,600 |
| 2023 | $6,883 | $373,200 | $81,700 | $291,500 |
| 2022 | $6,883 | $335,900 | $81,700 | $254,200 |
| 2021 | $6,950 | $302,700 | $87,200 | $215,500 |
| 2020 | $6,774 | $302,700 | $87,200 | $215,500 |
| 2019 | $6,599 | $302,700 | $87,200 | $215,500 |
| 2018 | $6,559 | $289,700 | $87,200 | $202,500 |
| 2017 | $6,373 | $289,700 | $87,200 | $202,500 |
| 2016 | $6,366 | $294,700 | $97,000 | $197,700 |
| 2015 | $6,153 | $294,700 | $97,000 | $197,700 |
Source: Public Records
Map
Nearby Homes