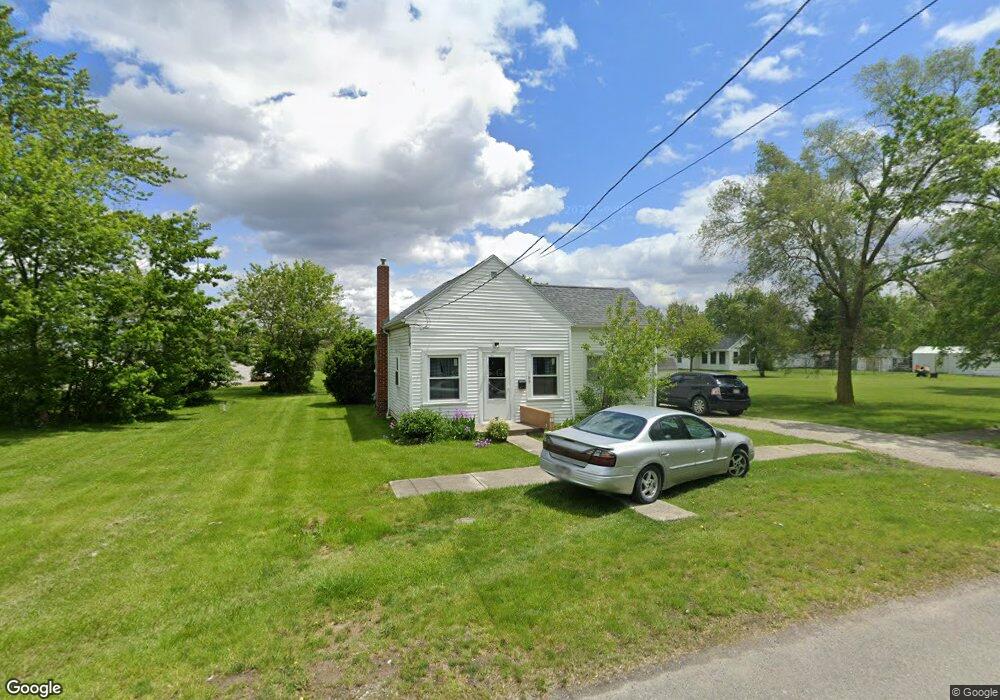
769 N Main St Paulding, OH 45879
Estimated Value: $76,000 - $101,000
2
Beds
1
Bath
940
Sq Ft
$91/Sq Ft
Est. Value
About This Home
This home is located at 769 N Main St, Paulding, OH 45879 and is currently estimated at $85,435, approximately $90 per square foot. 769 N Main St is a home located in Paulding County with nearby schools including Paulding High School.
Ownership History
Date
Name
Owned For
Owner Type
Purchase Details
Closed on
Aug 14, 2025
Sold by
True Grit Llc
Bought by
Board Of Education Of Paulding Exempted Villa
Current Estimated Value
Purchase Details
Closed on
Jan 12, 2016
Sold by
Woodson Bernice Le
Bought by
Tyray Curry
Home Financials for this Owner
Home Financials are based on the most recent Mortgage that was taken out on this home.
Original Mortgage
$18,500
Interest Rate
3.95%
Mortgage Type
Future Advance Clause Open End Mortgage
Purchase Details
Closed on
Jan 7, 2016
Sold by
Curry Tyray
Bought by
True Grit Llc
Home Financials for this Owner
Home Financials are based on the most recent Mortgage that was taken out on this home.
Original Mortgage
$18,500
Interest Rate
3.95%
Mortgage Type
Future Advance Clause Open End Mortgage
Purchase Details
Closed on
Dec 2, 2010
Sold by
Curry Tyray
Bought by
Woodson Bernice
Purchase Details
Closed on
Nov 23, 2010
Sold by
Woodson Bernice and Woodson Dorothy Bernice
Bought by
Curry Tyray
Create a Home Valuation Report for This Property
The Home Valuation Report is an in-depth analysis detailing your home's value as well as a comparison with similar homes in the area
Home Values in the Area
Average Home Value in this Area
Purchase History
| Date | Buyer | Sale Price | Title Company |
|---|---|---|---|
| Board Of Education Of Paulding Exempted Villa | -- | None Listed On Document | |
| Tyray Curry | -- | -- | |
| True Grit Llc | $15,000 | None Available | |
| Woodson Bernice | -- | None Available | |
| Curry Tyray | -- | None Available |
Source: Public Records
Mortgage History
| Date | Status | Borrower | Loan Amount |
|---|---|---|---|
| Previous Owner | True Grit Llc | $18,500 |
Source: Public Records
Tax History
| Year | Tax Paid | Tax Assessment Tax Assessment Total Assessment is a certain percentage of the fair market value that is determined by local assessors to be the total taxable value of land and additions on the property. | Land | Improvement |
|---|---|---|---|---|
| 2025 | $705 | $15,970 | $4,660 | $11,310 |
| 2024 | $705 | $13,650 | $3,990 | $9,660 |
| 2023 | $626 | $13,650 | $3,990 | $9,660 |
| 2022 | $608 | $13,650 | $3,990 | $9,660 |
| 2021 | $565 | $11,310 | $3,570 | $7,740 |
| 2020 | $508 | $11,310 | $3,570 | $7,740 |
| 2019 | $512 | $10,920 | $3,570 | $7,350 |
| 2018 | $504 | $10,920 | $3,570 | $7,350 |
| 2017 | $504 | $10,920 | $3,570 | $7,350 |
| 2016 | $504 | $10,920 | $3,570 | $7,350 |
| 2015 | $548 | $12,050 | $4,380 | $7,670 |
| 2014 | $546 | $12,050 | $4,380 | $7,670 |
| 2013 | $175 | $12,430 | $4,380 | $8,050 |
Source: Public Records
Map
Nearby Homes
- 726 N Main St
- 780 N Williams St
- 516 N Williams St
- 830 N Walnut St
- 741 Tom Tim Dr
- 402 N Williams St
- 308 N Main St
- 301 N Main St
- 829 Greenbriar Ave
- 508 W Jackson St
- 1065 Emerald Rd
- 215 N Dewitt St
- 614 W Jackson St
- 701 E Wayne St
- 520 W Wayne St
- 717 W Harrison St
- 714 W Wayne St
- 742 E Perry St
- 13688 Kay St
- 11051 Road 93
Your Personal Tour Guide
Ask me questions while you tour the home.