769 N Willow Green Way Farmington, UT 84025
Estimated Value: $436,000 - $471,000
3
Beds
2
Baths
1,845
Sq Ft
$246/Sq Ft
Est. Value
About This Home
This home is located at 769 N Willow Green Way, Farmington, UT 84025 and is currently estimated at $454,383, approximately $246 per square foot. 769 N Willow Green Way is a home located in Davis County with nearby schools including Knowlton Elementary School, Farmington High, and Farmington Junior High School.
Ownership History
Date
Name
Owned For
Owner Type
Purchase Details
Closed on
Aug 13, 2012
Sold by
Edwards F Christer
Bought by
Wardle Tyler
Current Estimated Value
Home Financials for this Owner
Home Financials are based on the most recent Mortgage that was taken out on this home.
Original Mortgage
$53,000
Outstanding Balance
$7,783
Interest Rate
2.91%
Mortgage Type
New Conventional
Estimated Equity
$446,600
Purchase Details
Closed on
May 11, 2012
Sold by
Edwards Catherine and Edwards Catherine Lee
Bought by
Edwards F Christer
Purchase Details
Closed on
Jul 12, 2007
Sold by
Farmington Development Corp
Bought by
Edwards F Christer and Edwards Catherine
Home Financials for this Owner
Home Financials are based on the most recent Mortgage that was taken out on this home.
Original Mortgage
$226,800
Interest Rate
6.41%
Mortgage Type
Purchase Money Mortgage
Create a Home Valuation Report for This Property
The Home Valuation Report is an in-depth analysis detailing your home's value as well as a comparison with similar homes in the area
Home Values in the Area
Average Home Value in this Area
Purchase History
| Date | Buyer | Sale Price | Title Company |
|---|---|---|---|
| Wardle Tyler | -- | Security Title Of Dav | |
| Edwards F Christer | -- | Accommodation | |
| Edwards F Christer | -- | Bonneville Superior Title Co |
Source: Public Records
Mortgage History
| Date | Status | Borrower | Loan Amount |
|---|---|---|---|
| Open | Wardle Tyler | $53,000 | |
| Previous Owner | Edwards F Christer | $226,800 |
Source: Public Records
Tax History Compared to Growth
Tax History
| Year | Tax Paid | Tax Assessment Tax Assessment Total Assessment is a certain percentage of the fair market value that is determined by local assessors to be the total taxable value of land and additions on the property. | Land | Improvement |
|---|---|---|---|---|
| 2025 | $2,392 | $239,250 | $70,400 | $168,850 |
| 2024 | $2,324 | $235,400 | $52,250 | $183,150 |
| 2023 | $2,308 | $427,000 | $103,000 | $324,000 |
| 2022 | $2,268 | $236,500 | $66,000 | $170,500 |
| 2021 | $2,055 | $319,000 | $91,800 | $227,200 |
| 2020 | $1,893 | $287,000 | $79,900 | $207,100 |
| 2019 | $1,909 | $281,000 | $70,000 | $211,000 |
| 2018 | $1,688 | $245,000 | $70,000 | $175,000 |
| 2016 | $1,431 | $107,525 | $20,900 | $86,625 |
| 2015 | $1,414 | $100,877 | $20,900 | $79,977 |
| 2014 | $1,355 | $99,336 | $18,333 | $81,003 |
| 2013 | -- | $99,663 | $14,850 | $84,813 |
Source: Public Records
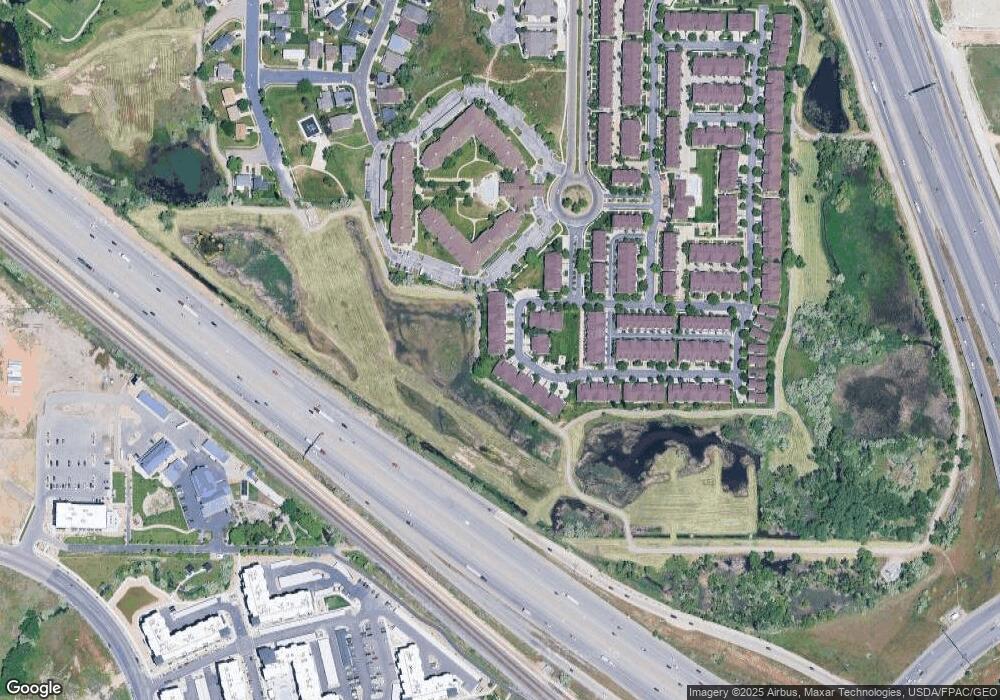
Map
Nearby Homes
- 1485 W Burke Ln Unit 102
- 1493 W Burke Ln Unit 101
- 907 Farmington Crossing
- 1008 N Shepard Creek Pkwy Unit 5
- 1048 Shepard Creek Pkwy Unit 4
- 1090 N Shepard Creek Pkwy Unit 6
- 695 W Hidden Farm Dr
- Major League Roof Deck + Basement Plan at Station Park
- Cabo + Basement Plan at Station Park
- 1177 Shepard Ln
- 604 Sego Way Unit 207
- 1484 W Kiera Ct Unit 146
- 1472 W Cook Ln Unit 164
- 1488 W Kiera Ct Unit 148
- 588 W 1175 N
- 1181 Set Ct Unit 2
- 60 N 1100 W
- 1207 W Jackson Ave
- 1383 Longhorn Dr
- 1327 Hidden Quail Cove Unit 6-A
- 769 N Willow Green Way
- 773 N Willow Green Way
- 773 N Willow Green Way
- 995 W Willow Green Way
- 777 N Willow Green Way
- 777 N Willow Green Way
- 993 W Willow Green Way
- 781 N Willow Green Way
- 991 Willow Green Way
- 768 N Willow Green Way
- 776 N Willow Green Way
- 785 N Willow Green Way
- 785 N Willow Green Way
- 768 N Willow Green Way
- 776 N Willow Green Way
- 987 W Willow Green Way
- 983 Willow Bend Way
- 983 W Willow Bend Way
- 995 Willow Green Way
- 789 N Willow Green Way