
SOLD AUG 10, 2015
RENTED JUN 9, 2025
769 Tremont St Unit 3 Boston, MA 02118
South End Neighborhood
1
Bed
1
Bath
672
Sq Ft
871
Sq Ft Lot
About This Home
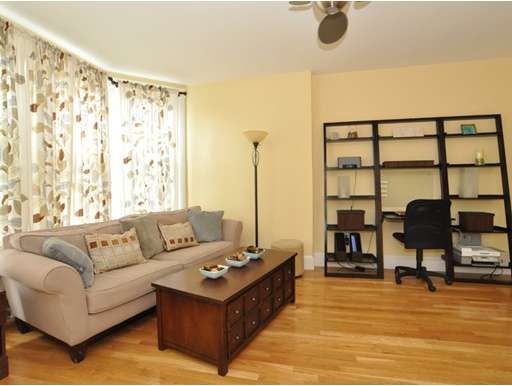
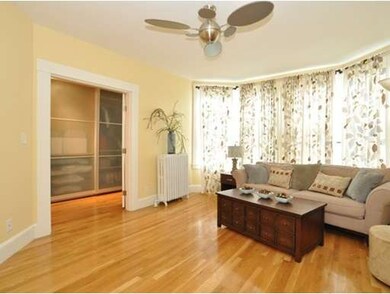
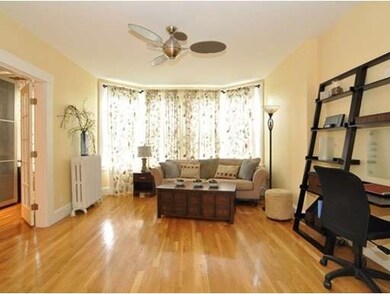
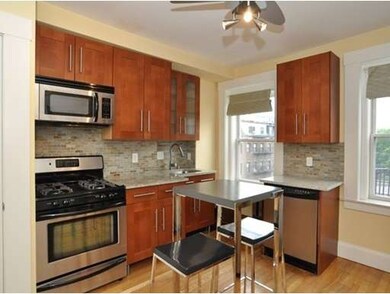
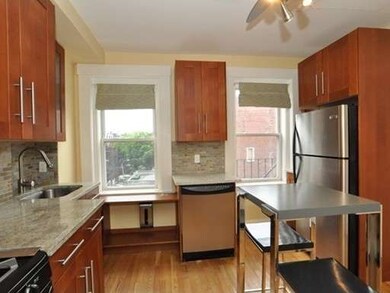
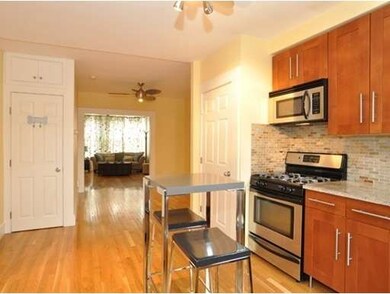
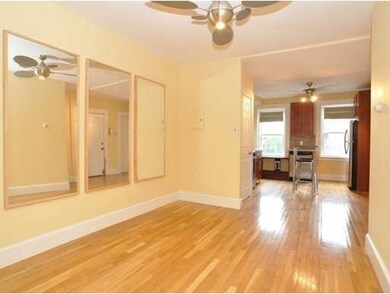
As of March 2022Large one bedroom penthouse. Great layout has separate dining & living areas. Hardwood floors, large bay with oversize windows. Eat-in kitchen has granite counter tops & stainless steel appliances. Beautiful tile bathroom. Easy access to common ROOF DECK w/ grill, furniture and great city views! Because of commercial space in building (florist), lenders may require 20-25% down payment. Unit is tenanted until 8/31/15. Showings begin Friday afternoon 5/29, by appointment.
Last Agent to Sell the Property
Gibson Sotheby's International Realty Listed on: 05/27/2015
Property Details
Home Type
Condominium
Est. Annual Taxes
$8,034
Year Built
1899
Lot Details
0
Listing Details
- Unit Level: 3
- Other Agent: 1.00
- Special Features: None
- Property Sub Type: Condos
- Year Built: 1899
Interior Features
- Has Basement: No
- Number of Rooms: 4
Garage/Parking
- Parking Spaces: 0
Utilities
- Cooling: None
- Heating: Hot Water Baseboard
Condo/Co-op/Association
- Association Fee Includes: Hot Water, Water, Sewer, Master Insurance
- Pets Allowed: Yes
- No Units: 4
- Unit Building: 3
Lot Info
- Assessor Parcel Number: W:09 P:00784 S:016
Ownership History
Date
Name
Owned For
Owner Type
Purchase Details
Listed on
Feb 9, 2022
Closed on
Mar 20, 2022
Sold by
Yehiav Guy and Yehiav Maya
Bought by
Ma Ruishan
Seller's Agent
Jonathan Finlay
Longwood Residential, LLC
Buyer's Agent
Montivista Real Estate Group
eXp Realty
List Price
$599,000
Sold Price
$595,000
Premium/Discount to List
-$4,000
-0.67%
Current Estimated Value
Home Financials for this Owner
Home Financials are based on the most recent Mortgage that was taken out on this home.
Estimated Appreciation
$131,752
Avg. Annual Appreciation
6.12%
Purchase Details
Listed on
May 27, 2015
Closed on
Aug 10, 2015
Sold by
Parulan Elizabeth D
Bought by
Yehiav Guy and Yehiav Maya
Seller's Agent
Laura Spence
Gibson Sotheby's International Realty
Buyer's Agent
Susan Ormont
Keller Williams Realty
List Price
$449,000
Sold Price
$461,000
Premium/Discount to List
$12,000
2.67%
Home Financials for this Owner
Home Financials are based on the most recent Mortgage that was taken out on this home.
Avg. Annual Appreciation
3.92%
Original Mortgage
$345,750
Interest Rate
4%
Mortgage Type
New Conventional
Similar Homes in the area
Create a Home Valuation Report for This Property
The Home Valuation Report is an in-depth analysis detailing your home's value as well as a comparison with similar homes in the area
Home Values in the Area
Average Home Value in this Area
Purchase History
| Date | Type | Sale Price | Title Company |
|---|---|---|---|
| Not Resolvable | $595,000 | None Available | |
| Not Resolvable | $461,000 | -- |
Source: Public Records
Mortgage History
| Date | Status | Loan Amount | Loan Type |
|---|---|---|---|
| Previous Owner | $345,750 | New Conventional |
Source: Public Records
Property History
| Date | Event | Price | Change | Sq Ft Price |
|---|---|---|---|---|
| 06/09/2025 06/09/25 | Rented | $3,100 | -3.1% | -- |
| 05/12/2025 05/12/25 | For Rent | $3,200 | +54.2% | -- |
| 01/18/2025 01/18/25 | For Rent | $2,075 | 0.0% | -- |
| 01/17/2025 01/17/25 | For Rent | $2,075 | 0.0% | -- |
| 03/25/2022 03/25/22 | Sold | $595,000 | -0.7% | $885 / Sq Ft |
| 03/10/2022 03/10/22 | Pending | -- | -- | -- |
| 02/09/2022 02/09/22 | For Sale | $599,000 | 0.0% | $891 / Sq Ft |
| 04/08/2021 04/08/21 | Rented | $2,500 | 0.0% | -- |
| 04/07/2021 04/07/21 | Under Contract | -- | -- | -- |
| 03/29/2021 03/29/21 | For Rent | $2,500 | -5.7% | -- |
| 04/17/2019 04/17/19 | Rented | $2,650 | 0.0% | -- |
| 04/01/2019 04/01/19 | Under Contract | -- | -- | -- |
| 03/12/2019 03/12/19 | For Rent | $2,650 | +6.0% | -- |
| 05/12/2017 05/12/17 | Rented | $2,500 | 0.0% | -- |
| 05/04/2017 05/04/17 | Under Contract | -- | -- | -- |
| 04/26/2017 04/26/17 | For Rent | $2,500 | +6.4% | -- |
| 12/01/2015 12/01/15 | Rented | $2,350 | 0.0% | -- |
| 11/23/2015 11/23/15 | Under Contract | -- | -- | -- |
| 10/13/2015 10/13/15 | Price Changed | $2,350 | -4.1% | $3 / Sq Ft |
| 09/22/2015 09/22/15 | Price Changed | $2,450 | 0.0% | $4 / Sq Ft |
| 08/10/2015 08/10/15 | Sold | $461,000 | 0.0% | $686 / Sq Ft |
| 08/10/2015 08/10/15 | For Rent | $2,595 | 0.0% | -- |
| 06/04/2015 06/04/15 | Pending | -- | -- | -- |
| 05/27/2015 05/27/15 | For Sale | $449,000 | -- | $668 / Sq Ft |
Source: MLS Property Information Network (MLS PIN)
Tax History Compared to Growth
Tax History
| Year | Tax Paid | Tax Assessment Tax Assessment Total Assessment is a certain percentage of the fair market value that is determined by local assessors to be the total taxable value of land and additions on the property. | Land | Improvement |
|---|---|---|---|---|
| 2025 | $8,034 | $693,800 | $0 | $693,800 |
| 2024 | $7,308 | $670,500 | $0 | $670,500 |
| 2023 | $6,989 | $650,700 | $0 | $650,700 |
| 2022 | $6,742 | $619,700 | $0 | $619,700 |
| 2021 | $6,612 | $619,700 | $0 | $619,700 |
| 2020 | $6,086 | $576,300 | $0 | $576,300 |
| 2019 | $5,898 | $559,600 | $0 | $559,600 |
| 2018 | $5,532 | $527,900 | $0 | $527,900 |
| 2017 | $5,276 | $498,200 | $0 | $498,200 |
| 2016 | $5,270 | $479,100 | $0 | $479,100 |
| 2015 | -- | $423,000 | $0 | $423,000 |
| 2014 | $4,884 | $388,200 | $0 | $388,200 |
Source: Public Records
Agents Affiliated with this Home
-
D
Seller's Agent in 2025
Dan Wu
Hooli Homes Boston
(617) 458-3008
54 Total Sales
-
B
Buyer's Agent in 2025
Brendon Perrier
Boardwalk Properties
-
J
Seller's Agent in 2022
Jonathan Finlay
Longwood Residential, LLC
(617) 396-3100
1 in this area
9 Total Sales
-
R
Seller Co-Listing Agent in 2022
Ron Ifrah
Longwood Residential, LLC
(617) 319-1085
1 in this area
26 Total Sales
-
M
Buyer's Agent in 2022
Montivista Real Estate Group
eXp Realty
(917) 345-9488
2 in this area
111 Total Sales
-
Seller's Agent in 2021
Ricardo Rodriguez
Coldwell Banker Realty - Boston
(617) 796-6084
72 in this area
342 Total Sales
Map
Source: MLS Property Information Network (MLS PIN)
MLS Number: 71845197
APN: CBOS-000000-000009-000784-000016
Disclaimer: Certain information contained herein is derived from information provided by parties other than Homes.com. All information provided is deemed reliable, but is not guaranteed to be accurate and should be independently verified.
![]() The property listing data and information, or the Images, set forth herein were provided to MLS Property Information Network, Inc. from third party sources, including sellers, lessors and public records, and were compiled by MLS Property Information Network, Inc. The property listing data and information, and the Images, are for the personal, non-commercial use of consumers having a good faith interest in purchasing or leasing listed properties of the type displayed to them and may not be used for any purpose other than to identify prospective properties which such consumers may have a good faith interest in purchasing or leasing. MLS Property Information Network, Inc. and its subscribers disclaim any and all representations and warranties as to the accuracy of the property listing data and information, or as to the accuracy of any of the Images, set forth herein.
The property listing data and information, or the Images, set forth herein were provided to MLS Property Information Network, Inc. from third party sources, including sellers, lessors and public records, and were compiled by MLS Property Information Network, Inc. The property listing data and information, and the Images, are for the personal, non-commercial use of consumers having a good faith interest in purchasing or leasing listed properties of the type displayed to them and may not be used for any purpose other than to identify prospective properties which such consumers may have a good faith interest in purchasing or leasing. MLS Property Information Network, Inc. and its subscribers disclaim any and all representations and warranties as to the accuracy of the property listing data and information, or as to the accuracy of any of the Images, set forth herein.
Nearby Homes
- 203 W Springfield St Unit A
- 211 W Springfield St
- 196 W Springfield St Unit 1
- 144 Worcester St Unit 2
- 144 Worcester St Unit 1
- 144 Worcester St Unit 3
- 470 Massachusetts Ave Unit 1
- 492 Massachusetts Ave Unit 53
- 492 Massachusetts Ave Unit 63
- 460 Massachusetts Ave Unit B
- 566 Columbus Ave Unit 614
- 8 Concord Square Unit 1
- 455 Massachusetts Ave Unit 1
- 455 Massachusetts Ave Unit 2
- 455 Massachusetts Ave Unit 4
- 38 Concord Square Unit 2
- 451-453 Massachusetts Ave Unit 8
- 40 Concord Square Unit 2
- 40 Concord Square Unit 1
- 15 Concord Square Unit 1A